Comparative Study
. 2010 Dec 15;182(12):1524-32.
doi: 10.1164/rccm.201002-0294OC. Epub 2010 Aug 6.

Threshold of biologic responses of the small airway epithelium to low levels of tobacco smoke

Affiliations
Comparative Study

Threshold of biologic responses of the small airway epithelium to low levels of tobacco smoke

Yael Strulovici-Barel et al. Am J Respir Crit Care Med. .

Abstract

Rationale: Epidemiologic data demonstrate that individuals exposed to low levels of tobacco smoke have decrements in lung function and higher risk for lung disease compared with unexposed individuals. Although this risk is small, low-level tobacco smoke exposure is so widespread, it is a significant public health concern.

Objectives: To identify biologic correlates of this risk we hypothesized that, compared with unexposed individuals, individuals exposed to low levels of tobacco smoke have biologic changes in the small airway epithelium, the site of the first abnormalities associated with smoking.

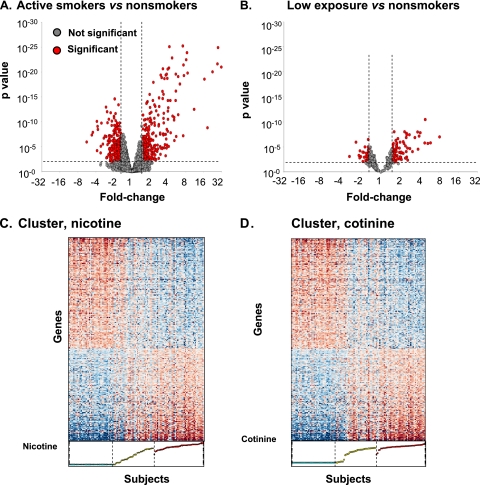
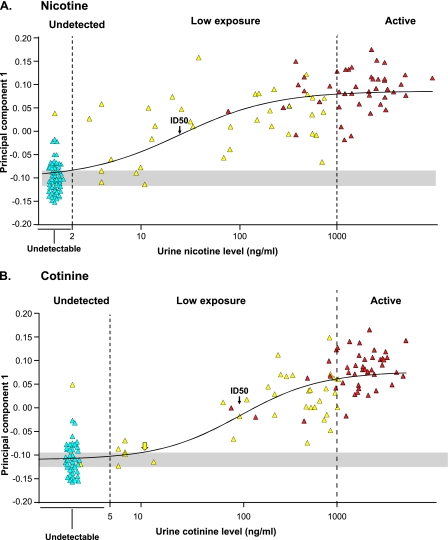
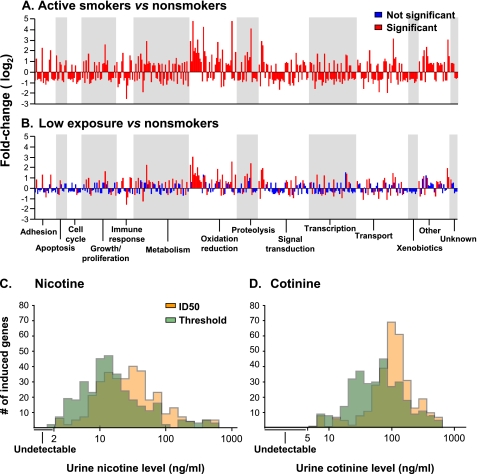
Methods: Small airway epithelium was obtained by bronchoscopy from 121 individuals; microarrays were used to assess genome-wide gene expression; urine nicotine and cotinine were used to categorize subjects as "nonsmokers," "active smokers," and "low exposure." Gene expression data were used to determine the threshold and induction half maximal level (ID₅₀) of urine nicotine and cotinine at which the small airway epithelium showed abnormal responses.

Measurements and main results: There was no threshold of urine nicotine without a small airway epithelial response, and only slightly above detectable urine cotinine threshold with a small airway epithelium response. The ID₅₀ for nicotine was 25 ng/ml and for cotinine it was 104 ng/ml.

Conclusions: The small airway epithelium detects and responds to low levels of tobacco smoke with transcriptome modifications. This provides biologic correlates of epidemiologic studies linking low-level tobacco smoke exposure to lung health risk, identifies the genes most sensitive to tobacco smoke, and defines thresholds at which the lung epithelium responds to low levels of tobacco smoke.


Figures

Figure 1.
Figure 1.
Differential gene expression profiles in the small airway epithelium in healthy nonsmokers, healthy active smokers, and healthy individuals exposed to low levels of tobacco smoke. Expression levels normalized by array were compared for active smokers (n = 45) and healthy nonsmokers (n = 40) for all probe sets “present” in at least 20% of samples in the Affymetrix HG-U133 Plus 2.0 array. The smoking-responsive probe sets (n = 612) were determined using a criteria of fold-change ≥ 1.5 (calculated as the average expression value of each probe set in all smokers divided by the average expression value in all nonsmokers), and P < 0.01 with Benjamini-Hochberg correction (see Table E1 for the complete list). Out of the 612 smoking-responsive probe sets, there were 372 probe sets representing known and unique genes. (A, B) Volcano plot showing all probe sets present in the small airway epithelium for ≥ 20% of the nonsmokers and active smokers. The fold-change of expression level for active smokers versus nonsmokers (log2, abscissa) is plotted against the P value (ordinate) by t test. Each dot represents a probe set, red dots represent probe sets with a significant difference in expression level, and gray dots represent probe sets not differentially expressed. (A) Active smokers versus nonsmokers, n = 612 probe sets. (B) Individuals exposed to low levels of tobacco smoke versus nonsmokers, n = 128 probe sets out of the 612 smoking-responsive genes. For each panel, genes that are up-regulated in active smokers or individuals exposed to low levels of tobacco smoke are to the top right and those that are down-regulated are to the top left. (C, D) Cluster of expression of smoking-responsive known genes in nonsmokers, active smokers, and smokers exposed to low levels of tobacco smoke. Blue indicates genes with decreased expression, red indicates genes with increased expression, and white indicates genes with average expression. The genes are represented horizontally and sorted by loading on the first principal component; the individual subjects are represented vertically and sorted by levels of either urine nicotine (C) or urine cotinine (D). All of the nonsmokers, active smokers, and individuals exposed to low levels of tobacco are included.
Figure 2.
Figure 2.
Comparison of overall small airway gene expression as defined by principal component 1 with levels of urine nicotine and cotinine. Shown is the score of each subject on principal component 1, obtained by decomposing the 372 genes by subjects matrix, versus levels of urine nicotine (A) or urine cotinine (B). In both panels, light blue represents nonsmokers, yellow represents individuals exposed to low levels of tobacco smoke, and red represents active smokers. Samples with undetectable levels of nicotine or cotinine are randomly displayed along the x axis for visualization purposes. The black line shows a best fit sigmoid curve with the half maximal (ID50) point indicated by the arrow (nicotine 25 ng/ml; cotinine 104 ng/ml) and threshold, as determined by the intersection of this line and 1 SD away from the mean of the nonsmokers. For nicotine, the threshold is below the detectable limit; for cotinine it is at 11 ng/ml indicated by the yellow arrow.
Figure 3.
Figure 3.
Genes in the small airway epithelium up- and down-regulated by smoking. (A, B) Categories of genes. Shown are skyscraper plots of fold-changes for the 372 unique, known genes significantly differentially expressed in active smokers versus nonsmokers in the small airway epithelium (P call “Present” in ≥ 20%, 1.5 fold-change up- or down-regulated; P < 0.01, with Benjamini-Hochberg correction). Fold-changes of the 372 smoking-responsive genes are presented on log2 scale. Alternating gray and white bands indicate probe sets that belong to different functional categories. (A) Fold-changes in active smokers (n = 45) versus nonsmokers (n = 40). (B) Fold-changes in individuals exposed to low levels of tobacco smoke (n = 36) versus nonsmokers (n = 40). (C, D) Histogram of threshold and ID50 for all 372 smoke-induced genes as determined by fitting a sigmoid function to the dose–response function for each gene as a function of nicotine and cotinine. Urine nicotine, median threshold 13.1 ng/ml, median ID50 27 ng/ml (C). Urine cotinine, median threshold 65 ng/ml, median ID50 108 ng/ml (D).

References

    1. Jaakkola MS, Jaakkola JJ. Effects of environmental tobacco smoke on the respiratory health of adults. Scand J Work Environ Health 2002;28:52–70. - PubMed
    1. Chan-Yeung M, Dimich-Ward H. Respiratory health effects of exposure to environmental tobacco smoke. Respirology 2003;8:131–139. - PubMed
    1. Janson C. The effect of passive smoking on respiratory health in children and adults. Int J Tuberc Lung Dis 2004;8:510–516. - PubMed
    1. 2004 Surgeon General's Report—The Health Consequences of Smoking (accessed October 19, 2010). Available from: http://www.cdc.gov/tobacco/data_statistics/sgr/2004/index.htm. 2004.
    1. Eisner MD, Wang Y, Haight TJ, Balmes J, Hammond SK, Tager IB. Secondhand smoke exposure, pulmonary function, and cardiovascular mortality. Ann Epidemiol 2007;17:364–373. - PubMed

Publication types