Comparative Study
. 2010 Dec 15;182(12):1546-53.
doi: 10.1164/rccm.200912-1888OC. Epub 2010 Aug 6.

Targeted delivery of amikacin into granuloma

Affiliations
Comparative Study

Targeted delivery of amikacin into granuloma

Ana Montes-Worboys et al. Am J Respir Crit Care Med. .

Abstract

Rationale: Nontuberculous mycobacterial (NTM) infection is a growing problem in the United States and remains underrecognized in the developing world. The management of NTM infections is further complicated by several factors, including the need to use high systemic doses of toxic agents, the length of therapy, and the development of drug resistance.

Objectives: We have evaluated the use of monocyte-derived dendritic cells (DCs) as a delivery vehicle for a luminescent derivative of amikacin prepared by conjugation to fluorescein isothiocyanate (FITC) (amikacin-FITC) into granulomas formed in the tissues of mice infected with Mycobacterium avium.

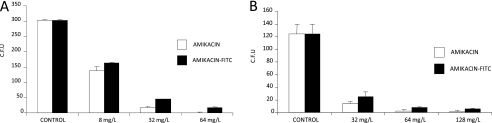
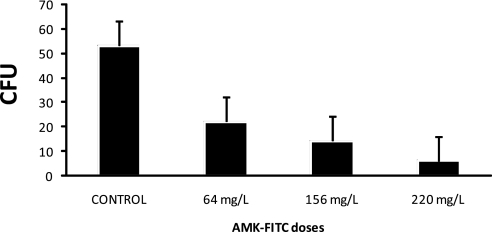
Methods: Amikacin-FITC was prepared and quantitative fluorescence was used to track the intracellular uptake of this modified antibiotic. The antibiotic activity of amikacin-FITC was also determined to be comparable to unmodified amikacin against M. avium. Amikacin-FITC-loaded DCs were first primed with M. avium, and then the cells were injected into the tail vein of infected mice. After 24 hours, the mice were sacrificed and the tissues were analyzed under fluorescence microscope.

Measurements and main results: We found that we were able to deliver amikacin into granulomas in a mouse model of disseminated mycobacterial infection. No increase in levels of monocyte chemoattractant protein-1 and its CCR2 as markers of inflammation were found when DCs were treated with amikacin-FITC.

Conclusions: DC-based drug delivery may be an adjunct and useful method of delivering high local concentrations of antibiotics into mycobacterial granulomas.


Figures

Figure 1.
Figure 1.
Detection of amikacin–fluorescein isothiocyanate (FITC) inside the cells. Dendritic cells (DCs) were treated with amikacin-FITC and cells were then observed under the fluorescence microscope; the pictures indicate the merge image with fluorescent filter and differential interference contrast (DIC) bright field. (A, B) CD11b monocyte DCs incubated with amikacin-FITC for 24 hours. The blue signal indicates the nuclei of the cells stained with DAPI and green signal due to the presence of amikacin conjugated with FITC dye. (A) 200× magnification; (B) 400× magnification. (C, D) RAW 264.7 cell line incubated with amikacin-FITC for 24 hours. The nuclei of the cells were stained with DAPI. Amikacin conjugated with FITC dye was visualized by green. (C) 100× magnification; (D) 100× magnification and merge with DIC bright field. (E, F) RAW 264.7 cells transformed into DCs in vitro with granulocyte-macrophage colony-stimulating factor and IL-4 cytokines for 5 to 7 days. Cells were marked with CD209 coated with FITC dye and observed under the fluorescence microscope. Blue indicates the nuclei stained with DAPI. Green localizes the CD209 mouse marker in the cells. (E) 200× magnification; (F) 200× magnification and merge with DIC bright field.
Figure 2.
Figure 2.
Levels of amikacin–fluorescein isothiocyanate (FITC) inside the RAW 264.7 cells. When the culture was confluent, cells were treated with 50 and 100 mg/L doses of amikacin-FITC and incubated for 6 hours at 4 and 37°C. The cells were collected and the fluorescent levels were measured spectrophotometrically. There is a dose-related increase in the fluorescence level for both temperatures assayed. The results are expressed as the mean of three different experiments.
Figure 3.
Figure 3.
Cell viability in RAW 264.7 cells incubated with amikacin–fluorescein isothiocyanate (FITC). Cells were treated with 50 and 100 mg/L doses of amikacin-FITC and incubated at 4 and 37°C for 6 hours. Then cells were pelleted and counted by Trypan blue dye exclusion. There were no significant differences between the control and the treated cell for any of the temperatures assayed. The results indicate the percentage of live cells and are expressed as the mean of three different experiments.
Figure 4.
Figure 4.
Cytokine production of RAW 264.7 cells incubated with different doses of amikacin–fluorescein isothiocyanate (FITC). Cultured cells were treated with different doses of amikacin-FITC (range from 25 to 50 mg/L) at 4 and 37°C. The supernatants were collected after 6 hours of incubation time and the monocyte chemoattractant protein (MCP)-1 levels were measured by ELISA. The results indicate no significant differences between the treatment and the control sample. The cells incubated at 4°C show less production of MCP-1 compared with the cells incubated at 37°C.
Figure 5.
Figure 5.
Gene expression of monocyte chemoattractant protein (MCP)-1 and CCR-2 proteins in RAW 264.7 cells. Cells were incubated with 50 and 100 mg/L of amikacin–fluorescein isothiocyanate (FITC) and were exposed to 4 and 37°C for 6 hours. The expressions of the MCP-1 and CCR-2 genes were analyzed by real-time polymerase chain reaction. The results were related to the expression of the RNA16S as a housekeeping gene. There were no significant differences between the treatment and the untreated sample for both MCP-1 and CCR-2. The different temperatures assayed did not alter the gene expression profile.
Figure 6.
Figure 6.
Effect of amikacin–fluorescein isothiocyanate (FITC) and free amikacin on the growth of (A) Mycobacterium avium and (B) Staphylococcus aureus. M. avium and S. aureus bacteria were treated with different doses of both free amikacin and amikacin conjugated with FITC dye. After 30 minutes of treatment, the bacteria cultures were grown in the specific agar plates and incubated at 37°C. After the incubation time, formed colonies were counted. (A) M. avium was incubated at 37°C for 14 days after the treatment. (B) S. aureus colonies were counting after 30 minutes' treatment with amikacin and amikacin-FITC. Plates incubated overnight at 37°C. The results show the mean of cfu from three plates of each dosage. There was the same profile in the decrease of colonies when amikacin-FITC was compared with free amikacin for both M. avium and S. aureus.
Figure 7.
Figure 7.
Inhibition of Mycobacterium avium growth inside the RAW 264.7 dendritic cell (DC)-loaded amikacin–fluorescein isothiocyanate (FITC). RAW 264.7 DCs were incubated with different doses of amikacin-FITC for 24 hours and cells were infected with M. avium at a 50:1 ratio. After 24 hours, cells were lysed and serial dilutions were plated in agar and incubated at 37°C. The number of colonies was quantified after 14 days.
Figure 8.
Figure 8.
Electrophoresis of polymerase chain reaction (PCR) products amplified with mycobacteria-specific primers. After PCR using chromosomal DNA as the template and specific primers, DNAs were separated in 2% agarose gel electrophoresis followed by ethidium bromide staining. Observation of a 435-bp PCR indicates the presence of mycobacteria. M, DNA size marker 100 bp (Bio-Rad, Hercules, CA); lane 1, RAW 264.7 cells without Mycobacterium avium; lane 2, RAW 264.7 cells incubated with M. avium for 24 hours (4× stock); lane 3, RAW 264.7 cells incubated with M. avium for 24 hours (2× stock); lane 4, RAW 264.7 cells loaded with amikacin–fluorescein isothiocyanate (FITC) (8 mg/L) and incubated with M. avium for 24 hours; lane 5, RAW 264.7 cells loaded with amikacin-FITC (64 mg/L) and incubated with M. avium for 24 hours; lane 6, H2O.
Figure 9.
Figure 9.
Colocalization of Mycobacterium avium and amikacin–fluorescein isothiocyanate (FITC) inside dendritic cells (DCs). Imaging of DCs stained with DAPI, amikacin-FITC visualized with FITC filter in green and M. avium stained with auramine-rhodamine and visualized with Texas-red filter in red. 400× magnification.
Figure 10.
Figure 10.
Presence of granuloma formation in the tissue of Mycobacterium avium–infected mice and detection of amikacin–fluorescein isothiocyanate (FITC) in the same sections. Imaging of mouse tissue staining with hematoxylin and eosin (H&E), and fluorescence for DAPI and amikacin-FITC. Lung: (A, B) H&E-stained sections; (C, D) fluorescence staining. The blue signal indicates the nuclei of the cells stained with DAPI and green signal the amikacin conjugated with FITC dye. Spleen: (A, B) H&E-stained sections; (C, D) fluorescence staining. The nuclei of the cells stained with DAPI and amikacin conjugated with FITC dye. Liver: (A, B) H&E-stained sections; (C, D) fluorescence staining. The nuclei of the cells stained with DAPI and amikacin conjugated with FITC dye. Kidney: (A, B) H&E-stained sections; (C, D) fluorescence staining. The nuclei of the cells stained with DAPI and amikacin conjugated with FITC dye. Heart: (A, B) H&E-stained sections; (C, D) fluorescence staining. The nuclei of the cells stained with DAPI and amikacin conjugated with FITC dye.
Figure 11.
Figure 11.
Levels of amikacin in bronchoalveolar lavage (BAL) and serum samples in infected and noninfected mice. Mice were infected with Mycobacterium avium for 6 months and injected with dendritic cells (DCs) loaded with amikacin–fluorescein isothiocyanate (FITC). Twenty-four hours later the mice were killed and serum and BAL were collected. Levels of amikacin were measured in both serum and BAL samples. We repeated the same protocol injecting DCs with amikacin-FITC in noninfected mice. Serum and BAL samples were analyzed for amikacin. Amikacin levels were detected in BAL but not in serum only in the group of mice infected with M. avium; in this group the presence of granulomas was confirmed by hematoxylin and eosin staining.

Comment in

References

    1. Sertl K, Takemura T, Tschachler E, Ferrans VJ, Kaliner MA, Shevach EM. Dendritic cells with antigen-presenting capability reside in airway epithelium, lung parenchyma, and visceral pleura. J Exp Med 1986;163:436–451. - PMC - PubMed
    1. Steinman RM. The dendritic cell system and its role in immunogenicity. Annu Rev Immunol 1991;9:271–296. - PubMed
    1. Banchereau J, Steinman RM. Dendritic cells and the control of immunity. Nature 1998;392:245–252. - PubMed
    1. Mohagheghpour N, Gammon D, Kawamura LM, van Vollenhoven A, Benike CJ, Engleman EG. CTL response to Mycobacterium tuberculosis: identification of an immunogenic epitope in 19-kDa lipoprotein. J Immunol 1998;161:2400–2406. - PubMed
    1. Sprent J, Schaefer M. Antigen-presenting cells for unprimed T cells. Immunol Today 1989;10:17–23. - PubMed

Publication types

MeSH terms