. 2010 Dec;9(12):2571-85.
doi: 10.1074/mcp.M110.002915. Epub 2010 Aug 6.

The leukocyte nuclear envelope proteome varies with cell activation and contains novel transmembrane proteins that affect genome architecture

Affiliations

The leukocyte nuclear envelope proteome varies with cell activation and contains novel transmembrane proteins that affect genome architecture

Nadia Korfali et al. Mol Cell Proteomics. 2010 Dec.

Abstract

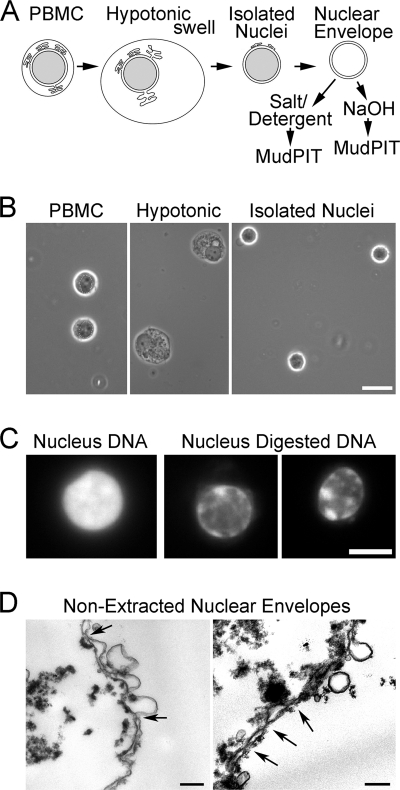
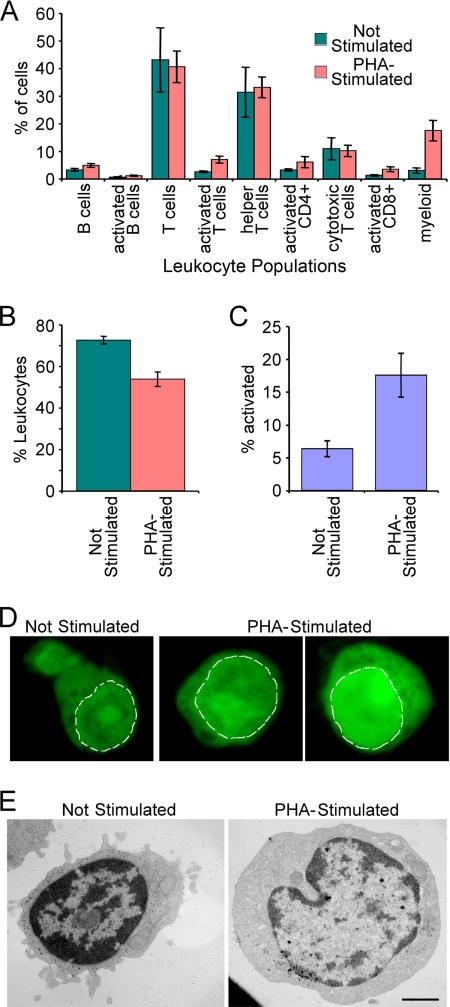
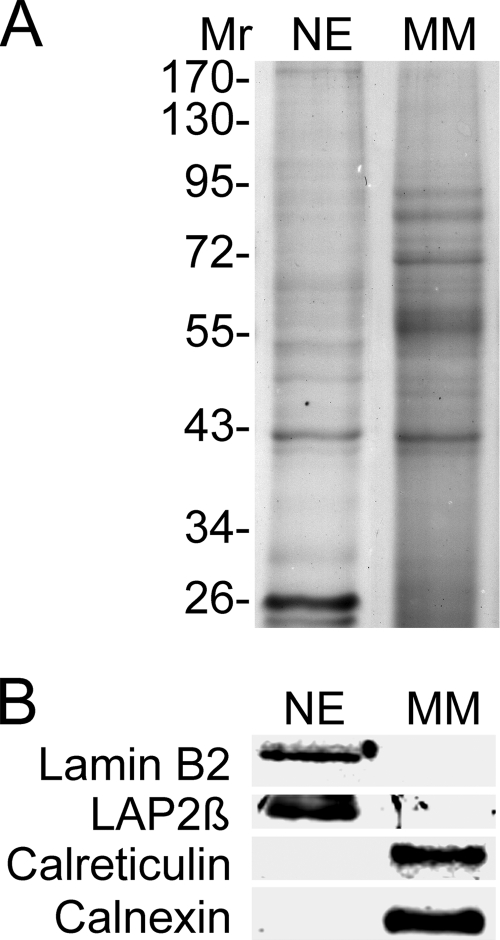
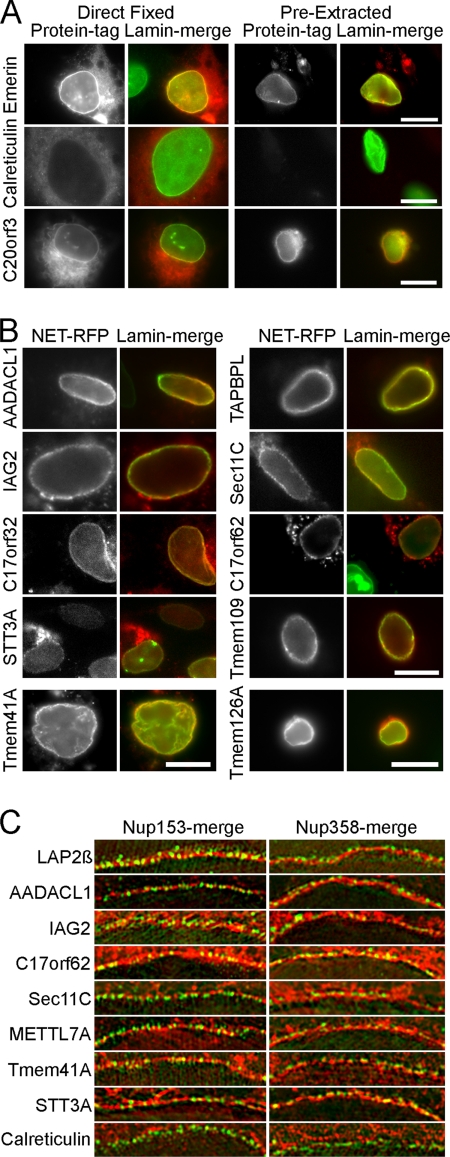
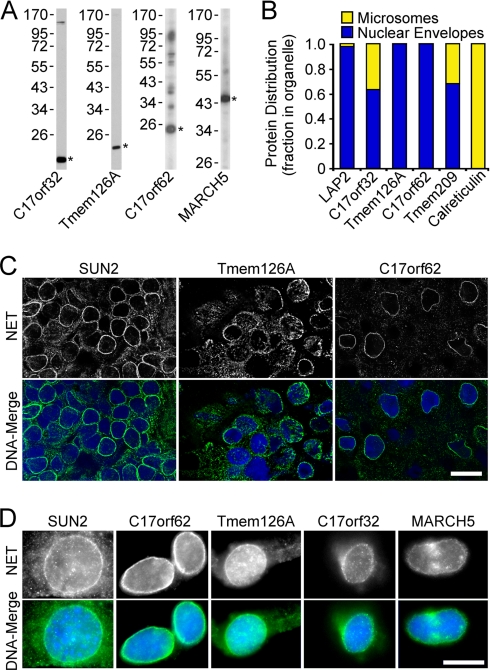
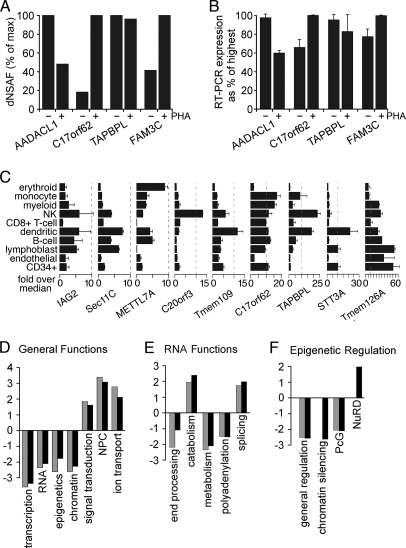
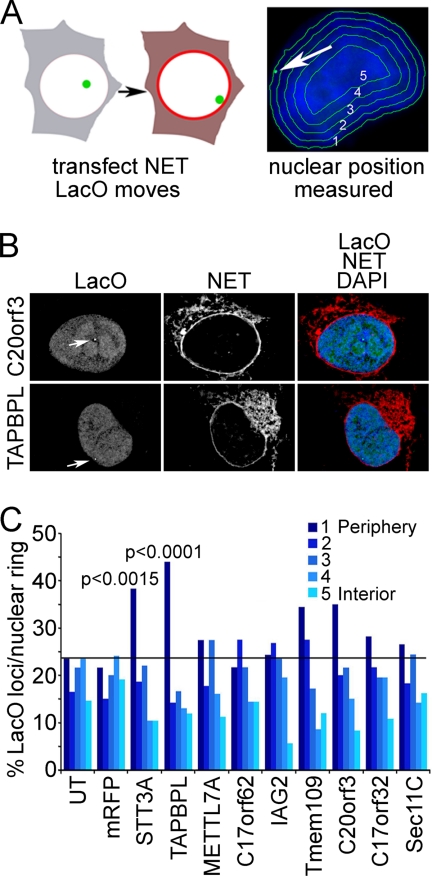
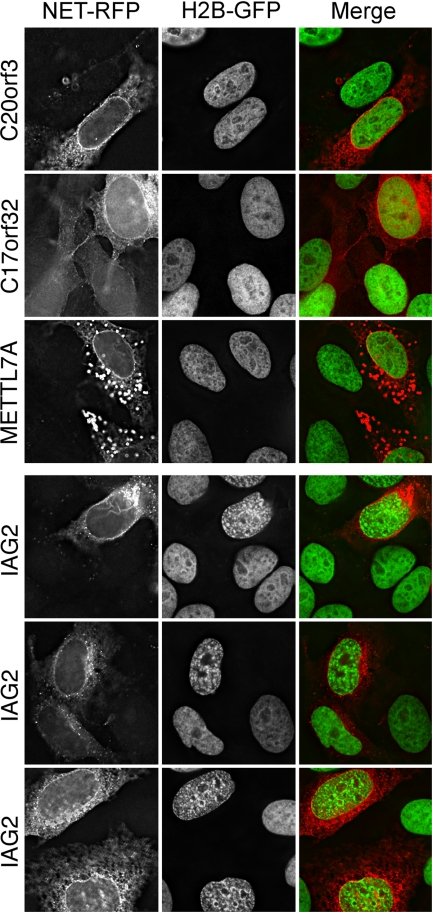
A favored hypothesis to explain the pathology underlying nuclear envelopathies is that mutations in nuclear envelope proteins alter genome/chromatin organization and thus gene expression. To identify nuclear envelope proteins that play roles in genome organization, we analyzed nuclear envelopes from resting and phytohemagglutinin-activated leukocytes because leukocytes have a particularly high density of peripheral chromatin that undergoes significant reorganization upon such activation. Thus, nuclear envelopes were isolated from leukocytes in the two states and analyzed by multidimensional protein identification technology using an approach that used expected contaminating membranes as subtractive fractions. A total of 3351 proteins were identified between both nuclear envelope data sets among which were 87 putative nuclear envelope transmembrane proteins (NETs) that were not identified in a previous proteomics analysis of liver nuclear envelopes. Nuclear envelope localization was confirmed for 11 new NETs using tagged fusion proteins and antibodies on spleen cryosections. 27% of the new proteins identified were unique to one or the other of the two leukocyte states. Differences in expression between activated and resting leukocytes were confirmed for some NETs by RT-PCR, and most of these proteins appear to only be expressed in certain types of blood cells. Several known proteins identified in both data sets have functions in chromatin organization and gene regulation. To test whether the novel NETs identified might include those that also regulate chromatin, nine were run through two screens for different chromatin effects. One screen found two NETs that can recruit a specific gene locus to the nuclear periphery, and the second found a different NET that promotes chromatin condensation. The variation in the protein milieu with pharmacological activation of the same cell population and consequences for gene regulation suggest that the nuclear envelope is a complex regulatory system with significant influences on genome organization.


Figures

Fig. 1.
Fig. 1.
Cellular fractionation of PBMCs. A, method schematic. Crude nuclei prepared from hypotonic lysis of PBMCs were cleaned of contaminating cellular structures by gradient centrifugation to float contaminating membranes while pelleting the denser nuclei. Crude NEs were prepared by digesting/extracting nuclear contents from isolated nuclei. Before MudPIT analysis, these were further extracted with 1% β-octyl glucoside, 400 mm NaCl or 0.1 n NaOH to enrich for proteins associated with the insoluble lamin polymer or integral membrane proteins, respectively. B, buffy coats from human blood were separated on Ficoll-Hypaque density gradients to enrich for mononuclear leukocytes (left panel). The cells were swollen hypotonically (middle panel) and Dounce homogenized to release nuclei (right panel), which were then further purified on sucrose gradients. Phase-contrast light microscope images are shown. Scale bar, 10 μm. C, enrichment for NEs by chromatin digestion. DAPI staining for DNA visualizes significant nuclear chromatin content in an isolated PBMC nucleus (left panel) and the loss of most of this material after two rounds of digestion with DNase and RNase, each followed by salt washes (two right panels). A fluorescence microscope image is shown. Scale bar, 5 μm. D, ultrastructure of isolated NEs. Electron micrographs of PBMC NEs show that most membranes in the population are the characteristic double membrane with little contamination from single membrane vesicles. Arrows point to positions of NPCs. In some places, the hypotonic treatment used to swell the NEs while digesting/extracting most of the chromatin resulted in membrane blebbing. These NEs were further extracted with salt and detergent to enrich for proteins associated with the intermediate filament lamin polymer or with an alkaline treatment to enrich for transmembrane proteins prior to analysis by MudPIT. After such treatment, no structure remains that can be readily discerned by EM with the characteristics of NEs. Scale bar, 0.2 μm.
Fig. 2.
Fig. 2.
PBMC composition. A, cells treated as for NE purification were incubated with CD markers for different blood cell types and analyzed by flow cytometry. The percentage of each cell type for PBMC composition in leukocytes is graphed. B, percentage of leukocytes in the total population. C, percentage of lymphocyte activation in the different PBMC populations measured by appearance of surface markers. Error bars in A, B, and C indicate standard deviation. D, PHA activation gauged by changes in nucleotide distribution using acridine orange dye. Acridine orange intercalates more strongly with single-stranded DNA than double-stranded DNA, so intensity to some degree measures “open” DNA that is being actively transcribed. A dashed white line delineates the periphery of the nucleus. The unstimulated PBMCs have weak staining at the periphery of the nucleus and no staining in some central areas. PHA-activated lymphocytes have more uniform distributions and brighter staining, indicating more open DNA. E, PHA activation effects on chromatin organization assessed by electron microscopy. The unstimulated cell is smaller and has more compacted chromatin concentrated at the nuclear periphery. In the PHA-activated cell, much of this dense peripheral chromatin has become less compact, and both the cell and nucleus have increased in volume as the activated cells are now rapidly transcribing DNA and making protein. Images were taken at 11,000×. Scale bar, 1 μm.
Fig. 3.
Fig. 3.
Fraction purity. A, Coomassie-stained gel of NE and microsome fractions analyzed. B, Western blot of the above fractions stained with organelle markers. ER markers calreticulin and calnexin were absent from NEs, whereas NE markers lamin B2 and the NET LAP2β were absent from microsomes. Similar amounts of total protein were loaded. MM, microsomal membranes.
Fig. 4.
Fig. 4.
mRFP fusions confirm NE targeting for several novel PBMC NETs. A, HT1080 cells expressing NETs fused to mRFP were directly fixed (left) or extracted with Triton X-100 prior to fixation (right). The NE is marked by lamin A in green so that yellow indicates co-localization of the NET at the NE. The directly fixed emerin image has part of an untransfected cell, confirming that none of the NET staining at the nuclear rim is due to bleed-through from the lamin A channel. Note that prefixation extraction affects morphology and sometimes leaves aggregated protein in the cytoplasm. The emerin control and new NET C20orf3 are retained after extraction, whereas the ER protein calreticulin is not. Scale bar, 10 μm. B, other NET-mRFP fusions were similarly pre-extracted and retained at the NE. Tmem41A is shown in COS-7 cells because it was not expressed in HT1080 cells, and Tmem126A is shown in Jurkat cells because it failed to be expressed in either HT1080 or COS-7 cells. Scale bar, 10 μm. C, inner versus outer nuclear membrane targeting. If a NET (red) is in the INM it should appear in the same plane as the nuclear basket protein Nup153 (green, left) and internal to the cytoplasmic filament protein Nup358 (green, right) using structured illumination microscopy. Characterized NET LAP2β and most new NETs tested appeared in the INM. One INM NET, METTL7A, did not resist Triton pre-extraction. Scale bars, 5 μm.
Fig. 5.
Fig. 5.
Antibody staining confirms novel NET identifications. A, NET antibody validation by Western blotting. C17orf32 and Tmem126A antibodies were tested on human PBMC lysates, whereas C17orf62 antibodies were tested on a C2C12 lysate to check background in the cell line used to test pre-extraction in D. MARCH5 antibodies were tested using the Jurkat human blood cell line. Asterisks indicate expected molecular weight. B, comparison of relative NET amounts in ER (microsome) and NE fractions by quantitative Western blotting. LAP2 and Tmem209 antibodies are NET controls, whereas calreticulin antibodies are an ER control. Blots were quantified using a LI-COR Odyssey system (three repeats averaged). C, cryosections of rat spleen stained with antibodies to new NETs and a SUN2 control. Nuclear rim staining was clearly observed for all NETs tested. Scale bars, 10 μm. D, antibody staining on Triton-pre-extracted C2C12 cells. A nuclear rim staining was observed for the control NET SUN2 and all novel NETs tested.
Fig. 6.
Fig. 6.
Differences in NE composition with PHA activation and effects on genome organization. A, differences in abundance estimated from dNSAF values for some NETs with or without PHA activation. dNSAF values were taken from the two most equivalent runs based on total protein coverage and identifications. B, RT-PCR of the NETs in A revealed reproducible differences in expression that are consistent with their abundance estimates based on peptide recoveries. C, transcript levels for several of the NETs identified differ among blood cell lineages. Data from the BioGPS transcriptome study comparing 84 different tissues/cell types are plotted relative to the median value over all 84 tissues sampled. Ticks along the bottom are for increments of 5-fold above the median. Each NET had its own unique expression pattern. Surface markers defining cell populations were CD71 for early erythroid cells, CD14 for monocytes, CD33 for myeloid cells, CD56 for natural killer (NK) cells, CD8 for T-cells, BDCA4 for myeloid dendritic cells, CD19 for B-cells, 721 for B-lymphoblasts, CD105 for endothelial cells, and CD34 for polyploidy progenitor cells. Error bars in B and C indicate standard deviation. D, within the subset of proteins in NE data sets with GO annotations, the fraction with a particular functional annotation was calculated. Similar fractions were calculated against all “nuclear”-annotated proteins in the GO database. The ratio of NE/nuclear fractions was then calculated, setting a 1:1 ratio to 0 so that positive values are -fold enrichment and negative values are -fold deficiency at the NE compared with the whole nucleus. Resting and activated PBMC data sets are represented by gray and black bars, respectively. E, the same analysis applied to the specific subset associated with RNA functions. F, the same analysis applied to the specific subset associated with functions in epigenetic regulation. PcG, Polycomb group.
Fig. 7.
Fig. 7.
Cell-based screen for PBMC NETs that promote recruitment of chromosome loci to nuclear periphery. A, schematic representation of a screen to determine whether overexpression of a particular NET can recruit a specific chromatin locus to the NE. NETs were transfected into cells containing a lacO repeat integration that is typically in the interior. The lacO position was visualized with GFP-lacI (green) and measured using an algorithm that partitions the nucleus based on DAPI staining (blue) into five concentric circles of roughly equal area. B, example of NET-transfected cells. The position of the lacO locus is highlighted by the white arrows. The lacO locus position is unaffected by C20orf3 expression but moves to the periphery with TAPBPL expression. DAPI staining added to the merged image confirms that the movement of the locus is not an artifact of generalized chromatin condensation at the periphery. Deconvolved images are shown. C, the ring containing the locus was recorded in roughly 100 transfected cells. p values were calculated for NETs that increased the locus at the periphery in comparison with untransfected (UT) or mRFP-transfected control cells using a χ2 test.
Fig. 8.
Fig. 8.
Screen for PBMC NETs that promote chromatin compaction. HeLa cells stably expressing H2B-GFP were transfected with the same set of nine NETs used in Fig. 7. Only IAG2 displayed strong chromatin condensation, whereas all other NETs (METTL7A, C17orf32, and C20orf3 are shown) exhibited no differences in chromatin compaction or distribution compared with adjacent untransfected cells. It is noteworthy that IAG2 had no effect in the lacO screen and that NETs STT3A and TAPBPL, which altered lacO positioning, had no effect on chromatin compaction.

Similar articles

Cited by

References

    1. Schirmer E. C., Foisner R. (2007) Proteins that associate with lamins: many faces, many functions. Exp. Cell Res. 313, 2167–2179 - PubMed
    1. Suntharalingam M., Wente S. R. (2003) Peering through the pore: nuclear pore complex structure, assembly, and function. Dev. Cell 4, 775–789 - PubMed
    1. Callan H. G., Tomlin S. G. (1950) Experimental studies on amphibian oocyte nuclei. I. Investigation of the structure of the nuclear membrane by means of the electron microscope. Proc. R. Soc. Lond. B Biol. Sci. 137, 367–378 - PubMed
    1. Starr D. A., Fischer J. A. (2005) KASH 'n Karry: the KASH domain family of cargo-specific cytoskeletal adaptor proteins. BioEssays 27, 1136–1146 - PubMed
    1. Stewart C. L., Roux K. J., Burke B. (2007) Blurring the boundary: the nuclear envelope extends its reach. Science 318, 1408–1412 - PubMed

Publication types