

Growth of the C4 dicot Flaveria bidentis: photosynthetic acclimation to low light through shifts in leaf anatomy and biochemistry
- PMID: 20693408
- PMCID: PMC2935879
- DOI: 10.1093/jxb/erq226
Growth of the C4 dicot Flaveria bidentis: photosynthetic acclimation to low light through shifts in leaf anatomy and biochemistry
Abstract
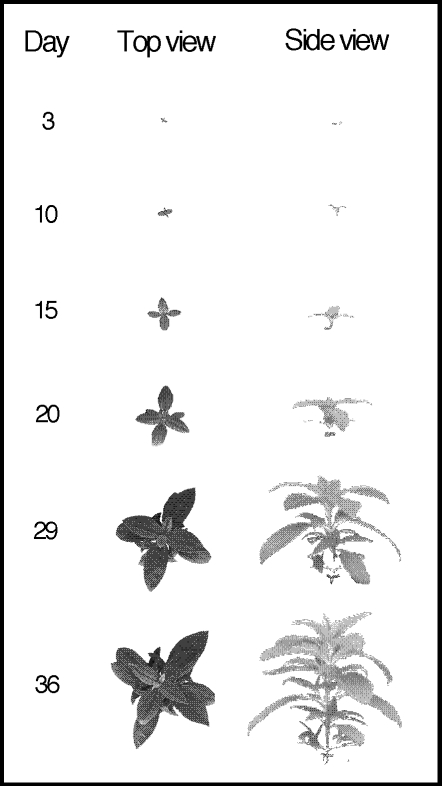
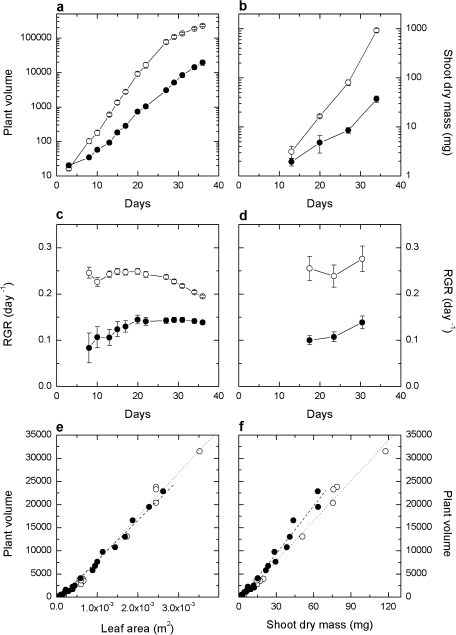
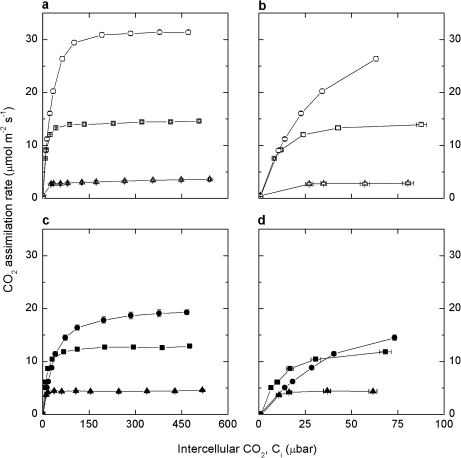
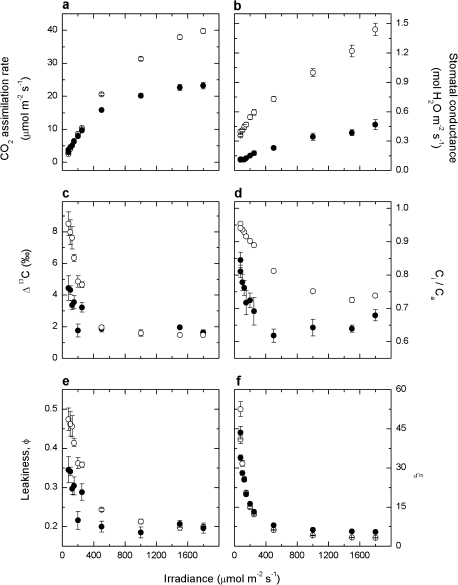
In C(4) plants, acclimation to growth at low irradiance by means of anatomical and biochemical changes to leaf tissue is considered to be limited by the need for a close interaction and coordination between bundle sheath and mesophyll cells. Here differences in relative growth rate (RGR), gas exchange, carbon isotope discrimination, photosynthetic enzyme activity, and leaf anatomy in the C(4) dicot Flaveria bidentis grown at a low (LI; 150 micromol quanta m(2) s(-1)) and medium (MI; 500 micromol quanta m(2) s(-1)) irradiance and with a 12 h photoperiod over 36 d were examined. RGRs measured using a 3D non-destructive imaging technique were consistently higher in MI plants. Rates of CO(2) assimilation per leaf area measured at 1500 micromol quanta m(2) s(-1) were higher for MI than LI plants but did not differ on a mass basis. LI plants had lower Rubisco and phosphoenolpyruvate carboxylase activities and chlorophyll content on a leaf area basis. Bundle sheath leakiness of CO(2) (phi) calculated from real-time carbon isotope discrimination was similar for MI and LI plants at high irradiance. phi increased at lower irradiances, but more so in MI plants, reflecting acclimation to low growth irradiance. Leaf thickness and vein density were greater in MI plants, and mesophyll surface area exposed to intercellular airspace (S(m)) and bundle sheath surface area per unit leaf area (S(b)) measured from leaf cross-sections were also both significantly greater in MI compared with LI leaves. Both mesophyll and bundle sheath conductance to CO(2) diffusion were greater in MI compared with LI plants. Despite being a C(4) species, F. bidentis is very plastic with respect to growth irradiance.
Figures
Similar articles
-
Antisense reduction of NADP-malic enzyme in Flaveria bidentis reduces flow of CO2 through the C4 cycle.Plant Physiol. 2012 Oct;160(2):1070-80. doi: 10.1104/pp.112.203240. Epub 2012 Jul 30. Plant Physiol. 2012. PMID: 22846191 Free PMC article.
-
Carbonic anhydrase and its influence on carbon isotope discrimination during C4 photosynthesis. Insights from antisense RNA in Flaveria bidentis.Plant Physiol. 2006 May;141(1):232-42. doi: 10.1104/pp.106.077776. Epub 2006 Mar 16. Plant Physiol. 2006. PMID: 16543411 Free PMC article.
-
Photosynthetic flexibility in maize exposed to salinity and shade.J Exp Bot. 2014 Jul;65(13):3715-24. doi: 10.1093/jxb/eru130. Epub 2014 Apr 1. J Exp Bot. 2014. PMID: 24692650 Free PMC article.
-
The efficiency of C(4) photosynthesis under low light conditions: assumptions and calculations with CO(2) isotope discrimination.J Exp Bot. 2011 May;62(9):3119-34. doi: 10.1093/jxb/err073. Epub 2011 Apr 28. J Exp Bot. 2011. PMID: 21527629 Review.
-
Is C4 photosynthesis less phenotypically plastic than C3 photosynthesis?J Exp Bot. 2006;57(2):303-17. doi: 10.1093/jxb/erj040. Epub 2005 Dec 19. J Exp Bot. 2006. PMID: 16364950 Review.
Cited by
-
Reduction of bundle sheath size boosts cyclic electron flow in C4 Setaria viridis acclimated to low light.Plant J. 2022 Sep;111(5):1223-1237. doi: 10.1111/tpj.15915. Plant J. 2022. PMID: 35866447 Free PMC article.
-
The coordination of C4 photosynthesis and the CO2-concentrating mechanism in maize and Miscanthus x giganteus in response to transient changes in light quality.Plant Physiol. 2014 Mar;164(3):1283-92. doi: 10.1104/pp.113.224683. Epub 2014 Jan 31. Plant Physiol. 2014. PMID: 24488966 Free PMC article.
-
Bundle sheath suberisation is required for C4 photosynthesis in a Setaria viridis mutant.Commun Biol. 2021 Feb 26;4(1):254. doi: 10.1038/s42003-021-01772-4. Commun Biol. 2021. PMID: 33637850 Free PMC article.
-
Antisense reduction of NADP-malic enzyme in Flaveria bidentis reduces flow of CO2 through the C4 cycle.Plant Physiol. 2012 Oct;160(2):1070-80. doi: 10.1104/pp.112.203240. Epub 2012 Jul 30. Plant Physiol. 2012. PMID: 22846191 Free PMC article.
-
Increased bundle-sheath leakiness of CO2 during photosynthetic induction shows a lack of coordination between the C4 and C3 cycles.New Phytol. 2022 Dec;236(5):1661-1675. doi: 10.1111/nph.18485. Epub 2022 Sep 30. New Phytol. 2022. PMID: 36098668 Free PMC article.
References
-
- Apel P, Peisker M. Einfluss hoher Sauerstoffkonzentrationen auf den CO2-Kompensationspunkt von C4-pflanzen. Kulturpflanze. 1978;26:99–103.
-
- Araus JL, Brown HR, Byrd GT, Serret MD. Comparative effects of growth irradiance on photosynthesis and leaf anatomy of Flaveris brownii (C4 like), Flaveria linearis (C3–C4), and their F1 hybrid. Planta. 1991;183:497–504. - PubMed
-
- Atkin OK, Schortemeyer M, McFarlane N, Evans JR. Variation in the components of relative growth rate in ten Acacia species from contrasting environments. Plant, Cell and Environment. 1998;21:1007–1017.
-
- Berry JA, Farquhar GD. The CO2 concentrating function of C4 photosynthesis: a biochemical model. In: Hall D, Coombs J, Goodwin T, editors. The Proceedings of the Fourth International Congress on Photosynthesis. London: Biochemical Society of London; 1978. pp. 119–131.
-
- Bjorkman O. Responses to different quantum flux densities. Berlin: Springer-Verlag; 1981.
Publication types
MeSH terms
Substances
LinkOut - more resources
Full Text Sources
Miscellaneous
