Is the remobilization of S and N reserves for seed filling of winter oilseed rape modulated by sulphate restrictions occurring at different growth stages?
- PMID: 20693411
- PMCID: PMC2955745
- DOI: 10.1093/jxb/erq233
Is the remobilization of S and N reserves for seed filling of winter oilseed rape modulated by sulphate restrictions occurring at different growth stages?
Abstract
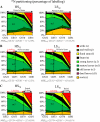
How the remobilization of S and N reserves can meet the needs of seeds of oilseed rape subject to limitation of S fertilization remains largely unclear. Thus, this survey aims to determine the incidence of sulphate restriction [low S (LS)] applied at bolting [growth stage (GS) 32], visible bud (GS 53), and start of pod filling (GS 70) on source-sink relationships for S and N, and on the dynamics of endogenous/exogenous S and N contributing to seed yield and quality. Sulphate restrictions applied at GS 32, GS 53, and GS 70 were annotated LS(32), LS(53), and LS(70). Long-term (34)SO(4)(2-) and (15)NO(3)(-) labelling was used to explore S and N partitioning at the whole-plant level. In LS(53), the sulphur remobilization efficiency (SRE) to seeds increased, but not enough to maintain seed quality. In LS(32), an early S remobilization from leaves provided S for root, stem, and pod growth, but the subsequent demand for seed development was not met adequately and the N utilization efficiency (NUtE) was reduced when compared with high S (HS). The highest SRE (65 ± 1.2% of the remobilized S) associated with an efficient foliar S mobilization (with minimal residual S concentrations of 0.1-0.2% dry matter) was observed under LS(70) treatment, which did not affect yield components.
Figures


Similar articles
-
The contrasting N management of two oilseed rape genotypes reveals the mechanisms of proteolysis associated with leaf N remobilization and the respective contributions of leaves and stems to N storage and remobilization during seed filling.BMC Plant Biol. 2015 Feb 21;15:59. doi: 10.1186/s12870-015-0437-1. BMC Plant Biol. 2015. PMID: 25848818 Free PMC article.
-
Remobilization of leaf S compounds and senescence in response to restricted sulphate supply during the vegetative stage of oilseed rape are affected by mineral N availability.J Exp Bot. 2009;60(11):3239-53. doi: 10.1093/jxb/erp172. Epub 2009 Jun 24. J Exp Bot. 2009. PMID: 19553370 Free PMC article.
-
Tuning of sulfur flow and sulfur seed metabolism in oilseed rape under sulfate-limited conditions.J Exp Bot. 2025 May 27;76(8):2278-2296. doi: 10.1093/jxb/eraf028. J Exp Bot. 2025. PMID: 39869110
-
Rapeseed species and environmental concerns related to loss of seeds of genetically modified oilseed rape in Japan.GM Crops. 2010 May-Jun;1(3):143-56. doi: 10.4161/gmcr.1.3.12761. GM Crops. 2010. PMID: 21844669 Review.
-
Research Progress on the Effect of Nitrogen on Rapeseed between Seed Yield and Oil Content and Its Regulation Mechanism.Int J Mol Sci. 2023 Sep 25;24(19):14504. doi: 10.3390/ijms241914504. Int J Mol Sci. 2023. PMID: 37833952 Free PMC article. Review.
Cited by
-
Sulphur limitation provokes physiological and leaf proteome changes in oilseed rape that lead to perturbation of sulphur, carbon and oxidative metabolisms.BMC Plant Biol. 2013 Feb 7;13:23. doi: 10.1186/1471-2229-13-23. BMC Plant Biol. 2013. PMID: 23391283 Free PMC article.
-
Physiological stress and higher reproductive success in bumblebees are both associated with intensive agriculture.PeerJ. 2022 Mar 2;10:e12953. doi: 10.7717/peerj.12953. eCollection 2022. PeerJ. 2022. PMID: 35256917 Free PMC article.
-
Seed Yield Components and Seed Quality of Oilseed Rape Are Impacted by Sulfur Fertilization and Its Interactions With Nitrogen Fertilization.Front Plant Sci. 2019 Apr 16;10:458. doi: 10.3389/fpls.2019.00458. eCollection 2019. Front Plant Sci. 2019. PMID: 31057573 Free PMC article.
-
The contrasting N management of two oilseed rape genotypes reveals the mechanisms of proteolysis associated with leaf N remobilization and the respective contributions of leaves and stems to N storage and remobilization during seed filling.BMC Plant Biol. 2015 Feb 21;15:59. doi: 10.1186/s12870-015-0437-1. BMC Plant Biol. 2015. PMID: 25848818 Free PMC article.
-
SuMoToRI, an Ecophysiological Model to Predict Growth and Sulfur Allocation and Partitioning in Oilseed Rape (Brassica napus L.) Until the Onset of Pod Formation.Front Plant Sci. 2015 Nov 17;6:993. doi: 10.3389/fpls.2015.00993. eCollection 2015. Front Plant Sci. 2015. PMID: 26635825 Free PMC article.
References
-
- Blake-Kalff MMA, Zhao FJ, McGrath SP. Sulphur deficiency diagnosis using plant tissue analysis. The International Fertiliser Society proceedings. 2002;503
-
- Desclos M, Dubousset L, Etienne P, Le Cahérec F, Satoh H, Bonnefoy J, Ourry A, Avice JC. A proteomic profiling approach to reveal a novel role of BnD22 (Brassica napus drought 22 kD)/water soluble chlorophyll binding protein in young leaves during nitrogen remobilization induced by stressful conditions. Plant Physiology. 2008;147:1830–1844. - PMC - PubMed
-
- Desclos M, Etienne P, Coquet L, Cosette P, Bonnefoy J, Segura R, Reze S, Ourry A, Avice JC. A combined 15N tracing/proteomics study in Brassica napus reveals the chronology of proteomics events associated to N remobilisation during leaf senescence induced by nitrate limitation or starvation. Proteomics. 2009;9:3580–3608. - PubMed
Publication types
MeSH terms
Substances
LinkOut - more resources
Full Text Sources
Miscellaneous

