Evaluating the growth potential of pathogenic bacteria in water
- PMID: 20693455
- PMCID: PMC2950443
- DOI: 10.1128/AEM.00794-10
Evaluating the growth potential of pathogenic bacteria in water
Abstract
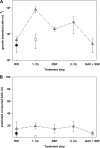
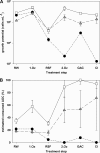
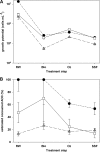
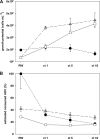
The degree to which a water sample can potentially support the growth of human pathogens was evaluated. For this purpose, a pathogen growth potential (PGP) bioassay was developed based on the principles of conventional assimilable organic carbon (AOC) determination, but using pure cultures of selected pathogenic bacteria (Escherichia coli O157, Vibrio cholerae, or Pseudomonas aeruginosa) as the inoculum. We evaluated 19 water samples collected after different treatment steps from two drinking water production plants and a wastewater treatment plant and from ozone-treated river water. Each pathogen was batch grown to stationary phase in sterile water samples, and the concentration of cells produced was measured using flow cytometry. In addition, the fraction of AOC consumed by each pathogen was estimated. Pathogen growth did not correlate with dissolved organic carbon (DOC) concentration and correlated only weakly with the concentration of AOC. Furthermore, the three pathogens never grew to the same final concentration in any water sample, and the relative ratio of the cultures to each other was unique in each sample. These results suggest that the extent of pathogen growth is affected not only by the concentration but also by the composition of AOC. Through this bioassay, PGP can be included as a parameter in water treatment system design, control, and operation. Additionally, a multilevel concept that integrates the results from the bioassay into the bigger framework of pathogen growth in water is discussed. The proposed approach provides a first step for including pathogen growth into microbial risk assessment.
Figures


Similar articles
-
A rapid technique for assessing assimilable organic carbon of UV/H2O2-treated water.J Environ Sci Health A Tox Hazard Subst Environ Eng. 2013;48(9):1086-93. doi: 10.1080/10934529.2013.774608. J Environ Sci Health A Tox Hazard Subst Environ Eng. 2013. PMID: 23573929
-
Competition of Escherichia coli O157 with a drinking water bacterial community at low nutrient concentrations.Water Res. 2012 Dec 1;46(19):6279-90. doi: 10.1016/j.watres.2012.08.043. Epub 2012 Sep 14. Water Res. 2012. PMID: 23062788
-
Escherichia coli O157 can grow in natural freshwater at low carbon concentrations.Environ Microbiol. 2008 Sep;10(9):2387-96. doi: 10.1111/j.1462-2920.2008.01664.x. Epub 2008 May 28. Environ Microbiol. 2008. PMID: 18507671
-
Differences in dissolved organic matter between reclaimed water source and drinking water source.Sci Total Environ. 2016 May 1;551-552:133-42. doi: 10.1016/j.scitotenv.2015.12.111. Epub 2016 Feb 12. Sci Total Environ. 2016. PMID: 26874770 Review.
-
Assimilable organic carbon (AOC) variation in reclaimed water: Insight on biological stability evaluation and control for sustainable water reuse.Bioresour Technol. 2018 Apr;254:290-299. doi: 10.1016/j.biortech.2018.01.111. Epub 2018 Feb 3. Bioresour Technol. 2018. PMID: 29398290 Review.
Cited by
-
Potential pathogen communities in highly polluted river ecosystems: Geographical distribution and environmental influence.Ambio. 2020 Jan;49(1):197-207. doi: 10.1007/s13280-019-01184-z. Epub 2019 Apr 24. Ambio. 2020. PMID: 31020611 Free PMC article.
-
Changing climate and socio-economic conditions as part of quantitative microbial risk assessment of surface drinking water sources: a review.J Water Health. 2025 Apr;23(4):507-528. doi: 10.2166/wh.2025.486. Epub 2025 Mar 20. J Water Health. 2025. PMID: 40298269 Review.
-
Biological instability in a chlorinated drinking water distribution network.PLoS One. 2014 May 5;9(5):e96354. doi: 10.1371/journal.pone.0096354. eCollection 2014. PLoS One. 2014. PMID: 24796923 Free PMC article.
-
Influence of Plant Species, Tissue Type, and Temperature on the Capacity of Shiga-Toxigenic Escherichia coli To Colonize, Grow, and Be Internalized by Plants.Appl Environ Microbiol. 2019 May 16;85(11):e00123-19. doi: 10.1128/AEM.00123-19. Print 2019 Jun 1. Appl Environ Microbiol. 2019. PMID: 30902860 Free PMC article.
-
Dose-response algorithms for water-borne Pseudomonas aeruginosa folliculitis.Epidemiol Infect. 2015 May;143(7):1524-37. doi: 10.1017/S0950268814002532. Epub 2014 Oct 2. Epidemiol Infect. 2015. PMID: 25275553 Free PMC article.
References
-
- Camper, A. K., P. W. Butterfield, B. D. Ellis, W. L. Jones, P. M. Huck, W. B. Anderson, C. Volk, N. J. Welch, and M. W. LeChevallier. 2000. Investigation of the biological stability of water in treatment plants and distribution systems. American Water Works Association Research Foundation, Denver, CO.
-
- Chen, C., X. Zhang, W. He, W. Lu, and H. Han. 2007. Comparison of seven kinds of drinking water treatment processes to enhance organic material removal: a pilot test. Sci. Total Environ. 382:93-102. - PubMed
Publication types
MeSH terms
Substances
LinkOut - more resources
Full Text Sources
Miscellaneous

