. 2010 Nov;20(11):1512-25.
doi: 10.1101/gr.109405.110. Epub 2010 Aug 6.

CRX ChIP-seq reveals the cis-regulatory architecture of mouse photoreceptors

Affiliations

CRX ChIP-seq reveals the cis-regulatory architecture of mouse photoreceptors

Joseph C Corbo et al. Genome Res. 2010 Nov.

Abstract

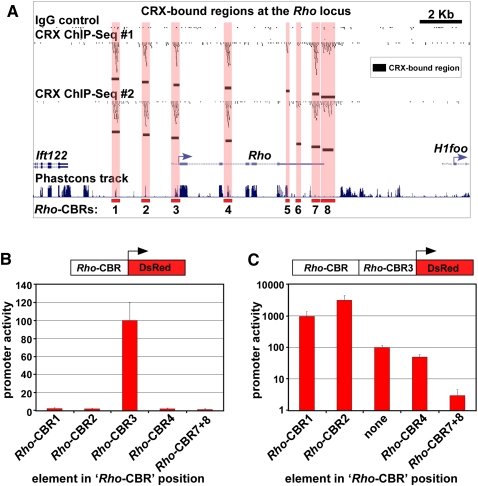
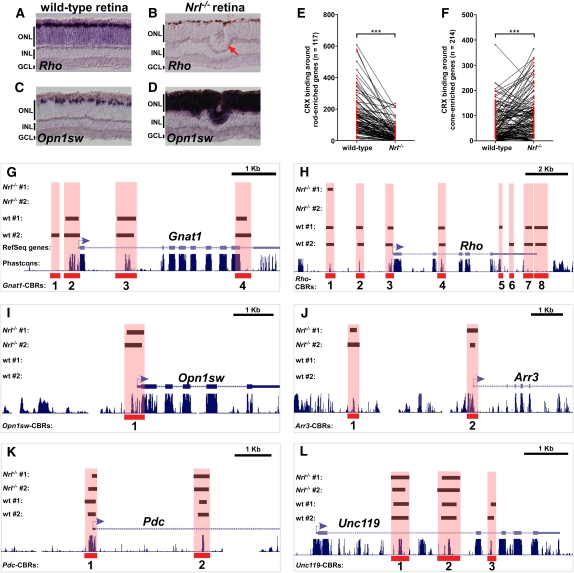
Approximately 98% of mammalian DNA is noncoding, yet we understand relatively little about the function of this enigmatic portion of the genome. The cis-regulatory elements that control gene expression reside in noncoding regions and can be identified by mapping the binding sites of tissue-specific transcription factors. Cone-rod homeobox (CRX) is a key transcription factor in photoreceptor differentiation and survival, but its in vivo targets are largely unknown. Here, we used chromatin immunoprecipitation with massively parallel sequencing (ChIP-seq) on CRX to identify thousands of cis-regulatory regions around photoreceptor genes in adult mouse retina. CRX directly regulates downstream photoreceptor transcription factors and their target genes via a network of spatially distributed regulatory elements around each locus. CRX-bound regions act in a synergistic fashion to activate transcription and contain multiple CRX binding sites which interact in a spacing- and orientation-dependent manner to fine-tune transcript levels. CRX ChIP-seq was also performed on Nrl(-/-) retinas, which represent an enriched source of cone photoreceptors. Comparison with the wild-type ChIP-seq data set identified numerous rod- and cone-specific CRX-bound regions as well as many shared elements. Thus, CRX combinatorially orchestrates the transcriptional networks of both rods and cones by coordinating the expression of photoreceptor genes including most retinal disease genes. In addition, this study pinpoints thousands of noncoding regions of relevance to both Mendelian and complex retinal disease.


Figures

Figure 1.
Figure 1.
Genomic distribution of CRX-bound regions in rod photoreceptors. (A) Hematoxylin and eosin (H&E)–stained section of adult retina and in situ hybridization on adult retina using a probe against Crx. There is strong, uniform staining for Crx throughout the outer nuclear layer (ONL; dark purple) which is composed of the cell bodies of both rod and cone photoreceptors. In addition, there is fainter staining in a subset of cells in the inner nuclear layer (INL) that represent bipolar cells. GCL, Ganglion cell layer. (B) Graph of gene density and CBR density across mouse chromosome 1, showing a strong correlation between the two. (C) Graph of gene density, CBR density, and the correlation between the two for a portion of mouse chromosome 2. In the central portion of the graph, there is a region of poor correlation between gene density and CBR density, which represents a large cluster of olfactory receptor genes. (D) Electron micrographs of a cone and rod nucleus along with antibody staining for CRX in a rod nucleus. In the antibody staining, the nuclei are counterstained with DAPI which highlights the heterochromatin. The bottom tier of the figure depicts schematics of the cone and rod nuclei, indicating the expected pattern of a marker for gene-rich euchromatin (H3K4me3) and two markers for gene-poor heterochromatin (H4K20me3 and H3K9me3). These patterns of chromatin markers are based on a prior study (Solovei et al. 2009).
Figure 2.
Figure 2.
Sequence analysis of CRX-bound regions. (A) Sequence logo representing the single most highly overrepresented motif found in 10,212 CBRs derived from wild-type retina. (B) Sequence logo of the DNA-binding preference of in vitro synthesized CRX protein as determined by quantitative relative affinity gel shift assays (Lee et al. 2010). (C) The distribution of CRX binding sites across a 1-kb region centered on all replicated CBRs (blue curve) and a set of control sequences (red curve). The y-axis indicates the number of CRX sites per nucleotide that have an affinity ≥0.05 of the affinity of a consensus CRX site. The average size of the CBRs (267 bp) is indicated. (D) The average phylogenetic conservation across all replicated CBRs (blue curve) and a set of control sequences (red curve). The y-axis indicates the average phastCons score per nucleotide (Siepel et al. 2005). (E) Percentage GC content across all replicated CBRs (blue curve) and a set of control sequences (red curve). Also shown is the percentage GC content for all replicated CBRs that did (purple curve) or did not (green curve) overlap with CpG islands. (F) Predicted nucleosome occupancy based on a prior study (Kaplan et al. 2009), across all replicated CBRs (blue curve) and a set of control sequences (red curve). Also shown is the predicted nucleosome occupancy for all replicated CBRs that did (purple curve) or did not (green curve) overlap with CpG islands.
Figure 3.
Figure 3.
Distribution of CRX-bound regions around photoreceptor genes. (A) Pattern of CRX-bound regions around Gnat1 that encodes rod alpha-transducin, a component of the phototransduction cascade. Sequence reads derived from two ChIP-seq replicates using an anti-CRX antibody (“CRX ChIP-seq #1” and “CRX ChIP-seq #2”) or an IgG control (“IgG control”) are shown along with the corresponding CBRs. Also shown is the “Phastcons track,” which indicates the pattern of phlyogenetic conservation across the region (Siepel et al. 2005). In this and subsequent figures, CBRs are numbered from 5′ to 3′ with respect to the transcription start site of the gene with which they are associated. (B) Sequence-level view of a portion of Gnat1-CBR2. Note the presence of phylogenetically conserved CRX and NRL binding sites within this region. Additional conserved motifs are also evident, but their binding factors are currently unknown. (C) Distribution of CBRs around mouse genes. This graph shows the density of CBRs over the length of all mouse genes, as well as in the first 10 kb upstream of and downstream from all genes. Note that the location of CBRs within genes is given as percentage of gene length.
Figure 4.
Figure 4.
CRX-bound regions are photoreceptor-specific cis-regulatory elements. (A) The CBRs around a novel photoreceptor-enriched gene, Lrit2, act as photoreceptor-specific cis-regulatory elements. There are two CBRs within the first 2 kb upstream of the transcription start site that were bound in both CRX ChIP-seq replicates from wild-type retinas (“wt #1” and “wt #2”). PCR products encompassing these CBRs (highlighted in light red) were cloned into a DsRed reporter construct and co-electroporated along with a ubiquitously expressing CAG promoter into explanted P0 mouse retinas. The retinas were grown for 8 d and then imaged in both red and green channels in flat-mount and as cross-sections. All flat-mount images in this figure were exposed for the same length of time to permit comparison of the strength of expression. (B) CBRs around a known photoreceptor gene, Unc119, which, when mutated in humans, results in cone-rod dystrophy. Unc119-CBR1 was shown previously to drive strong photoreceptor-specific expression in electroporated retinas (Hsiau et al. 2007). Unc119-CBR3 also drives strong photoreceptor expression, whereas Unc119-CBR2 does not. (C) CBRs around another novel photoreceptor-enriched gene, Samd7. Samd7-CBR2 drives strong, photoreceptor-specific expression, whereas Samd7-CBR1 does not. (D) CBR around a photoreceptor-enriched gene, Ankrd33, which has recently been shown to inhibit the DNA-binding activity of CRX (Sanuki et al. 2010). Only a single CBR was found in the vicinity of Ankrd33. It shows strong photoreceptor-specific cis-regulatory activity.
Figure 5.
Figure 5.
CRX-bound regions act in a combinatorial fashion to drive photoreceptor gene expression. (A) Distribution of CBRs around the rhodopsin (Rho) gene, which encodes rod opsin, the primary light-sensing molecule of rod photoreceptors. (B) Quantitative analysis of Rho-CBR cis-regulatory activity in electroporated retinas. The indicated Rho-CBRs were cloned into a DsRed reporter and electroporated into P0 mouse retinas along with a Rho-CBR3-eGFP loading control. After 8 d in culture, the retinas were imaged in flat-mount, and promoter activity was quantified by measuring fluorescence (see Methods for details). Shown is the mean ± standard deviation of three replicate electroporations. All values are normalized to that of Rho-CBR3, which is set equal to 100. (C) Quantitative analysis of Rho-CBR cis-regulatory activity when cloned upstream of the Rho proximal promoter region (Rho-CBR3). Shown is the mean ± SD of three replicate electroporations. All values are normalized to that of Rho-CBR3 alone, which is set equal to 100. Note that the y-axis is on a log scale.
Figure 6.
Figure 6.
Rods and cones have both shared and cell type–specific CRX-bound regions. (A–D) In situ hybridization pattern of rod-specific rhodopsin (Rho) on wild-type (A) and Nrl−/− (B) retinas, and cone-specific blue opsin (Opn1sw) on wild-type (C) and Nrl−/− (D) retinas. In the wild-type retina, Rho is expressed in the majority of cells in the ONL, whereas Opn1sw is only expressed in a small subset of cells at the outer edge of the ONL. The Nrl−/− retina shows the converse pattern: Rho is completely absent, whereas Opn1sw is strongly expressed throughout the entire ONL. Rosette formation in common in the ONL of Nrl−/− retinas (red arrow in B). (E) CRX binding around rod-enriched genes in wild-type and Nrl−/− retinas. Each pair of red dots connected by a black line represents a single rod-enriched gene. The y-axis indicates the number of sequence reads within all CBRs assigned to that gene. There is a marked decrease in the number of assigned sequence reads for most rod genes in the Nrl−/− retina relative to wild-type. ***P < 0.0001, paired Student's t-test. (F) CRX binding around cone-enriched genes in wild-type and Nrl−/− retinas. In this case, there is an overall increase in CRX binding around cone genes in Nrl−/− retinas compared with wild-type. ***P < 0.0001, paired Student's t-test. Gnat1 (G) and Rho (H), both rod-specific genes, show a near absence of CBRs in the Nrl−/− retina. Opn1sw (I) and Arr3 (J), both cone-specific genes, show prominent CBRs in the Nrl−/− retina but not in wild-type. Pdc (K) and Unc119 (L) are expressed at similar levels in both rods and cones. They show similar levels of CRX binding in both wild-type and Nrl−/− retinas.

Similar articles

Cited by

References

    1. Akhmedov NB, Piriev NI, Chang B, Rapoport AL, Hawes NL, Nishina PM, Nusinowitz S, Heckenlively JR, Roderick TH, Kozak CA, et al. 2000. A deletion in a photoreceptor-specific nuclear receptor mRNA causes retinal degeneration in the rd7 mouse. Proc Natl Acad Sci 97: 5551–5556 - PMC - PubMed
    1. Akimoto M, Cheng H, Zhu D, Brzezinski JA, Khanna R, Filippova E, Oh EC, Jing Y, Linares JL, Brooks M, et al. 2006. Targeting of GFP to newborn rods by Nrl promoter and temporal expression profiling of flow-sorted photoreceptors. Proc Natl Acad Sci 103: 3890–3895 - PMC - PubMed
    1. Bateman E 1998. Autoregulation of eukaryotic transcription factors. Prog Nucleic Acid Res Mol Biol 60: 133–168 - PubMed
    1. Bessant DA, Payne AM, Mitton KP, Wang QL, Swain PK, Plant C, Bird AC, Zack DJ, Swaroop A, Bhattacharya SS 1999. A mutation in NRL is associated with autosomal dominant retinitis pigmentosa. Nat Genet 21: 355–356 - PubMed
    1. Blackshaw S, Fraioli RE, Furukawa T, Cepko CL 2001. Comprehensive analysis of photoreceptor gene expression and the identification of candidate retinal disease genes. Cell 107: 579–589 - PubMed

Publication types

MeSH terms

Associated data