doi: 10.1107/S1744309110023900.
Epub 2010 Jul 29.
Crystallization and preliminary X-ray analysis of tubulin-folding cofactor A from Arabidopsis thaliana
Affiliations
- PMID: 20693679
- PMCID: PMC2917302
- DOI: 10.1107/S1744309110023900
Item in Clipboard
Crystallization and preliminary X-ray analysis of tubulin-folding cofactor A from Arabidopsis thaliana
Acta Crystallogr Sect F Struct Biol Cryst Commun.
.
Abstract
Tubulin-folding cofactor A (TFC A) is a molecular post-chaperonin that is involved in the beta-tubulin-folding pathway. It has been identified in many organisms including yeasts, humans and plants. In this work, Arabidopsis thaliana TFC A was expressed in Escherichia coli and purified to homogeneity. After thrombin cleavage, a well diffracting crystal was obtained by the sitting-drop vapour-diffusion method at 289 K. The crystal diffracted to 1.6 A resolution using synchrotron radiation and belonged to space group I4(1), with unit-cell parameters a=55.0, b=55.0, c=67.4 A.
Figures
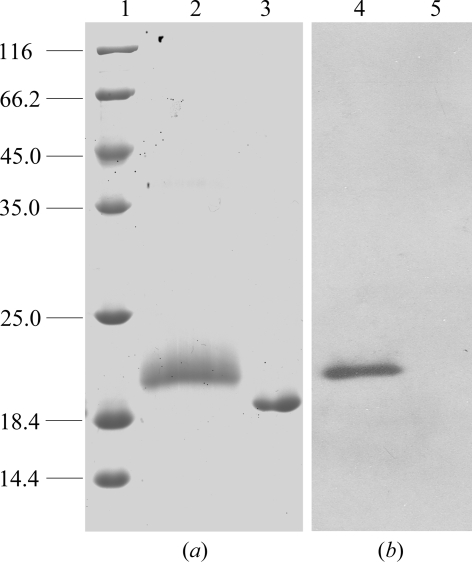
SDS–PAGE and Western blotting analyses of the proteins. (a) SDS–PAGE gel stained with Coomassie Brilliant Blue. Lane 1, molecular-weight markers (kDa); lane 2, His-tagged TFC A protein eluted from the Superdex 75 column; lane 3, dissolved TFC A crystals from protein that had been stored for three weeks at 277 K. (b) Western blotting analysis. The samples in lanes 4 and 5 correspond to those in lanes 2 and 3, respectively, but were diluted 100-fold.
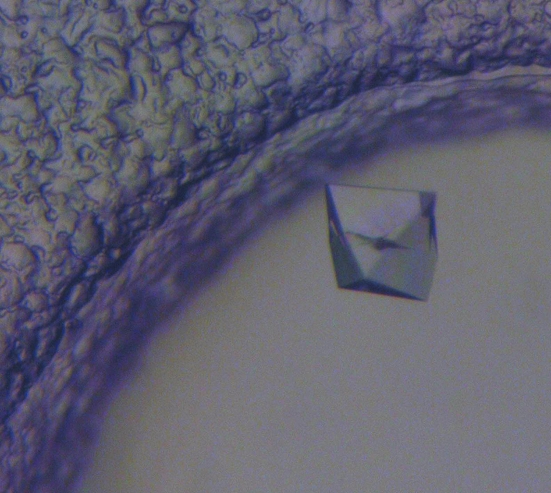
Crystal of TFC A grown by the sitting-drop method. The dimensions of the crystal are approximately 0.2 × 0.2 × 0.1 mm.
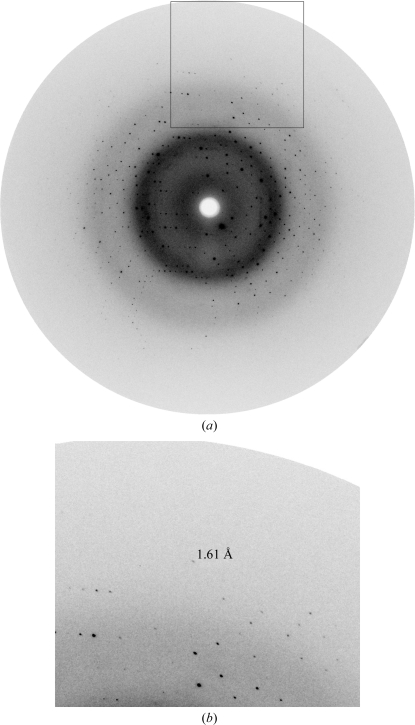
Diffraction pattern of the TFC A crystal. (a) A typical diffraction image. (b) An enlarged view showing the highest resolution spots.
Similar articles
-
Crystallization and preliminary crystallographic analysis of a C2 protein from Arabidopsis thaliana.Acta Crystallogr Sect F Struct Biol Cryst Commun. 2011 Dec 1;67(Pt 12):1575-8. doi: 10.1107/S1744309111040541. Epub 2011 Nov 26. Acta Crystallogr Sect F Struct Biol Cryst Commun. 2011. PMID: 22139170 Free PMC article.
-
Crystallization and preliminary crystallographic analysis of recombinant VSP1 from Arabidopsis thaliana.Acta Crystallogr Sect F Struct Biol Cryst Commun. 2010 Feb 1;66(Pt 2):201-3. doi: 10.1107/S1744309109053688. Epub 2010 Jan 28. Acta Crystallogr Sect F Struct Biol Cryst Commun. 2010. PMID: 20124723 Free PMC article.
-
Crystallization and preliminary X-ray data analysis of a DJ-1 homologue from Arabidopsis thaliana (AtDJ-1D).Acta Crystallogr Sect F Struct Biol Cryst Commun. 2012 Jan 1;68(Pt 1):101-4. doi: 10.1107/S1744309111050597. Epub 2011 Dec 24. Acta Crystallogr Sect F Struct Biol Cryst Commun. 2012. PMID: 22232184 Free PMC article.
-
Crystal structure of tubulin folding cofactor A from Arabidopsis thaliana and its beta-tubulin binding characterization.FEBS Lett. 2010 Aug 20;584(16):3533-9. doi: 10.1016/j.febslet.2010.07.017. Epub 2010 Jul 16. FEBS Lett. 2010. PMID: 20638386
-
The complex between SOS3 and SOS2 regulatory domain from Arabidopsis thaliana: cloning, expression, purification, crystallization and preliminary X-ray analysis.Acta Crystallogr Sect F Struct Biol Cryst Commun. 2007 Jul 1;63(Pt 7):568-70. doi: 10.1107/S174430910702533X. Epub 2007 Jun 11. Acta Crystallogr Sect F Struct Biol Cryst Commun. 2007. PMID: 17620712 Free PMC article.
References
-
- Archer, J. E., Vega, L. R. & Solomon, F. (1995). Cell, 82, 425–434. - PubMed
-
- Campo, R., Fontalba, A., Sanchez, L. M. & Zabala, J. C. (1994). FEBS Lett.353, 162–166. - PubMed
-
- Fanarraga, M. L., Parraga, M., Aloria, K., del Mazo, J., Avila, J. & Zabala, J. C. (1999). Cell Motil. Cytoskeleton, 43, 243–254. - PubMed
-
- Guasch, A., Aloria, K., Perez, R., Avila, J., Zabala, J. C. & Coll, M. (2002). J. Mol. Biol.318, 1139–1149. - PubMed
Publication types
MeSH terms
Substances
LinkOut - more resources
Full Text Sources
Molecular Biology Databases