. 2010 Sep;13(9):1075-81.
doi: 10.1038/nn.2603. Epub 2010 Aug 8.

PTEN deletion enhances the regenerative ability of adult corticospinal neurons

Affiliations

PTEN deletion enhances the regenerative ability of adult corticospinal neurons

Kai Liu et al. Nat Neurosci. 2010 Sep.

Abstract

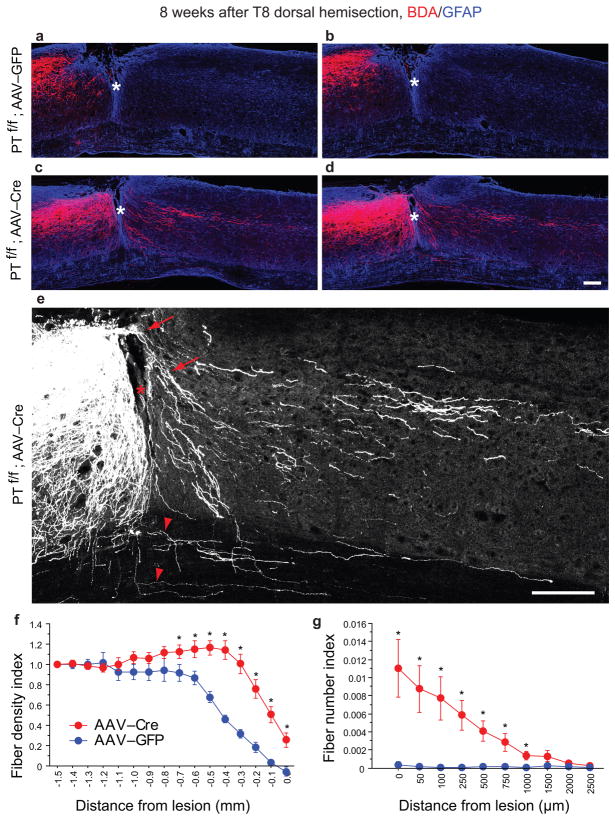
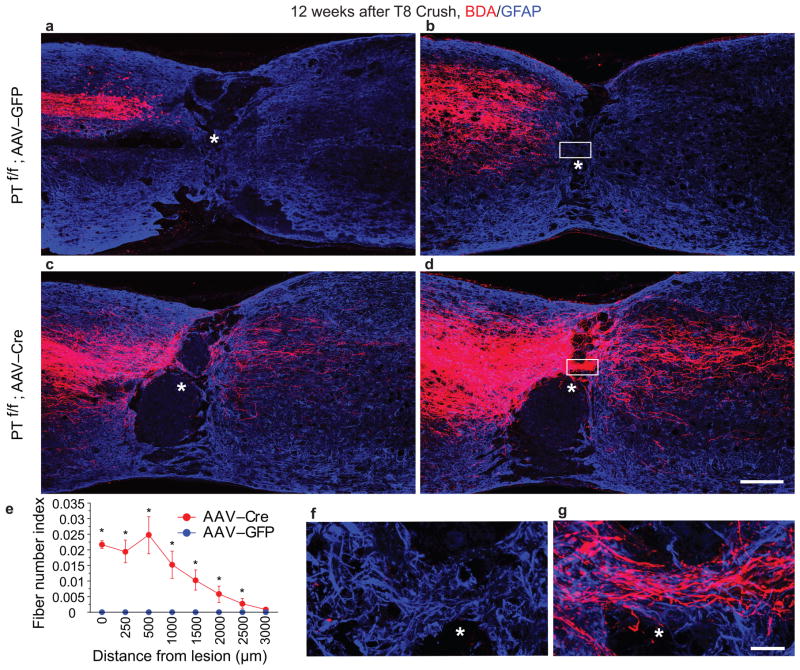
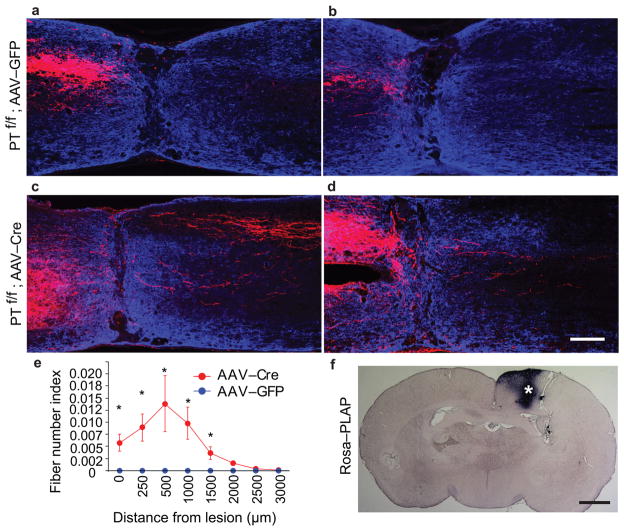
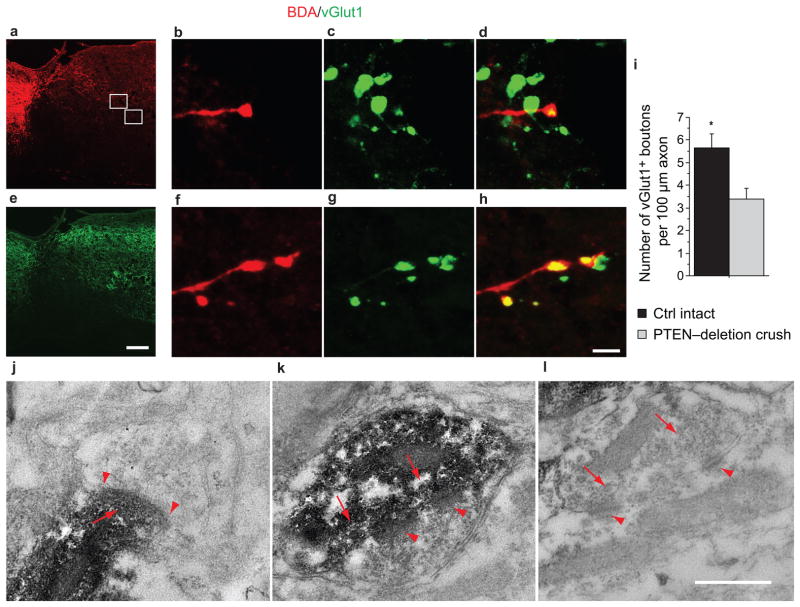
Despite the essential role of the corticospinal tract (CST) in controlling voluntary movements, successful regeneration of large numbers of injured CST axons beyond a spinal cord lesion has never been achieved. We found that PTEN/mTOR are critical for controlling the regenerative capacity of mouse corticospinal neurons. After development, the regrowth potential of CST axons was lost and this was accompanied by a downregulation of mTOR activity in corticospinal neurons. Axonal injury further diminished neuronal mTOR activity in these neurons. Forced upregulation of mTOR activity in corticospinal neurons by conditional deletion of Pten, a negative regulator of mTOR, enhanced compensatory sprouting of uninjured CST axons and enabled successful regeneration of a cohort of injured CST axons past a spinal cord lesion. Furthermore, these regenerating CST axons possessed the ability to reform synapses in spinal segments distal to the injury. Thus, modulating neuronal intrinsic PTEN/mTOR activity represents a potential therapeutic strategy for promoting axon regeneration and functional repair after adult spinal cord injury.


Figures

Figure 1
Figure 1. Correlation between age-dependent decrease of CST sprouting and phospho-S6 levels in corticospinal neurons
a–d, Representative images of cervical 7 (C7) spinal cord transverse sections from wild-type mice with a left pyramidotomy (Py) performed at P7 (b) or 2 months (d) and their respective controls (a, c). BDA was injected to the right sensorimotor cortex at 2 weeks post-injury and mice were terminated 2 weeks later. Scale bar: 500 μm. e, Quantification of sprouting axon density index (contralateral/ispilateral). *: p < 0.01, ANOVA followed by Bonferroni’s post-hoc test. f, Scheme of quantifying crossing axons at different regions of the spinal cord (Mid: midline, Z1 or Z2: different lateral positions). g, Quantification results with the methods indicated in (f) and then normalized against total numbers of labeled CST axons counted at the medulla in each animal. *: p < 0.01, two-way ANOVA followed by Bonferroni’s post-hoc test. For the quantification results in e–g, 4 mice in each of the control groups and 5 mice in the P7 groups and 7 mice in the 2 months groups were used. Three sections at the C7 level per animals were quantified. f–k, Representative images of the coronal sections of the layer 5 sensorimotor cortex from wild type mice at P7 (h) or 2 months (i) or 2 months-old PTENf/f (PTf/f) mice of with AAV-Cre (j) or AAV-GFP (k). Scale bar: 20 μm.
Figure 2
Figure 2. PTEN deletion prevents p-S6 down-regulation in corticospinal neurons after pyramidotomy
a, The experimental scheme to assess the p-S6 levels in the corticospinal neurons (CSMNs) in the sensorimotor cortex for the experiments shown in b–n. AAVs were injected to right cortex at P1 and the animals were subjected to C7 microruby injection at the age of 5 weeks and right pyramidotomy at the age of 6 weeks. The animals were terminated at 7 days after injury for p-S6 detection. b–m, Representative images of sagittal sections from the sham (b–d, h–j) or injured (e–g, k–m) side of layer 5 sensorimotor cortex from PTENf/f mice injected with control AAV (b–g) or AAV-Cre (h–m) stained with anti-p-S6 (b, e, h, k) or retrogradely labeled with microruby (c, f, i, l). The panels in (d, g, j, m) are the merged images. Scale bar: 20 μm. n, The quantification results of average p-S6+ intensity of CSMNs in comparison with that in intact ones. The intensities of more than 300 CSMNs from 3 animals in each group were quantified. p <0.001, ANOVA followed by Bonferroni’s post-hoc test.
Figure 3
Figure 3. PTEN deletion promotes CST sprouting in adult mice with unilateral pyramidotomy
a–p, Representative images of C7 spinal cord transverse sections (a, e, i, m), enlarged midline (b, f, j, n), Z1 (c, g, k, o), or Z2 (d, h, l, p) regions from sham (a–h) or injured (i–p) PTENf/f mice with AAV-GFP (a–d, i–l) or AAV-Cre (e–h, m–p). AAVs were injected to the right sensorimotor cortex of P1 PTENf/f mice that then received a left pyramidotomy or sham lesion at 2 months. BDA was injected to the right sensorimotor cortex at 2 weeks post-injury and the animals were terminated 2 weeks later. q, Quantification of sprouting axon density index (contralateral/ispilateral). *: p < 0.01, ANOVA followed by Bonferroni’s post-hoc test. r, Quantifications of crossing axons counted in different regions of spinal cord normalized against the numbers of labeled CST axons. *: p < 0.01, two-way ANOVA followed by Bonferroni’s post-hoc test. Five animals in each intact group and 6 animals in each pyramidotomy group were used. Three C7 spinal cord sections per animals were quantified. Scale bar: 500 μm (a, e, i, m), 50 μm (b–d, f–h, j–l, and n–p).
Figure 4
Figure 4. Increased CST regrowth in PTEN deleted mice after T8 dorsal hemisection
a–d, Representative images from sagittal sections from PTENf/f mice with right cortical injection of AAV-GFP (a, b) or AAV-Cre (c, d) at P1 and T8 dorsal hemisection at 6 weeks. BDA was injected to the right sensorimotor cortex at 6 weeks post-injury and the animals were terminated 2 weeks later. The sections were co-stained to detect BDA (red) and GFAP (blue). e, Enlarged images in (d) showing two types of labeled axons growing to the distal spinal cord: growing through the lesion sites (red arrow) and sprouting through the intact ventral spinal cord (red arrowhead). Red star denotes the lesion site. f, Quantification of the density of labeled CST axons in the spinal cord rostral to the lesion sites in two groups. *: p < 0.05, two–way ANOVA followed by Fisher’s LSD. g, Quantification of the CST axons quantified in the spinal cord distal to the lesion sites. *: p < 0.05, two-way ANOVA followed by Fisher’s LSD. 9 animals in AAV-GFP group and 11 in AAV-Cre groups were used. 4–5 sections per animals were quantified. Scale bar: 200 μm.
Figure 5
Figure 5. CST regeneration in PTEN deleted mice after a T8 spinal cord crush injury
a–d, Representative images from sagittal sections showing the main dorsal CST tract (a, c) or lateral CST axons in the gray matter (b, d) in PTENf/f mice with cortical injection of AAV-GFP (a, b) or AAV-Cre (c, d) at P1 and T8 crush injury at 6 weeks. BDA was injected to the sensorimotor cortex at 10 weeks after injury and the animals were terminated 2 weeks later. The sections were co-stained to detect BDA (red) and GFAP (blue). In contrast to control mice in which no labeled axons can be seen within or beyond the lesion, numerous axons grow through the lesion site and are detected in the distal spinal cord (up to 3 mm). Scale bar: 200 μm. e, Quantification of labeled axons in the spinal cord caudal to the lesion site in both groups. *: p < 0.05, two-way ANOVA followed by Fisher’s LSD. Eight animals in each group were used. Three sections per animals were quantified. f, g, Immunoflurorescent images showing sections from the matrix of the lesion sites of crushed PTENf/f mice with AAV-GFP (f) or AAV-Cre (g) detected with TSA-Cy3 (for BDA) and anti-GFAP antibodies. Scale bar: 20 μm.
Figure 6
Figure 6. CST regeneration in PTENf/f mice with AAV injection at 4 weeks and T8 spinal cord crush injury at 8 weeks
a–d, Representative images from sagittal sections showing the main dorsal CST tract (a, c) or lateral CST axons in the gray matter (b, d) in PTENf/f mice with cortical injection of AAV-GFP (a, b) or AAV-Cre (c, d) at the age of 4 weeks and T8 crush injury at 8 weeks. BDA was injected to the sensorimotor cortex at 10 weeks after injury and the animals were terminated 2 weeks later. The sections were co-stained to detect BDA (red) and GFAP (blue). Scale bar: 200 μm. e, Quantification of labeled axons in the spinal cord caudal to the lesion site in both groups. *: p < 0.05, two-way ANOVA followed by Fisher’s LSD. 5 animals in each group were used. 3 sections per animals were quantified. f, PLAP staining of a cortical section from a reporter mouse with AAV-Cre injection at the age of 4 weeks. By examining different sections covering entire hindlimb sensorimotor cortex, estimated PLAP+ areas in these mice is about 20% of the area of the reporter mice with neonatal AAV-Cre injection. Scale bar: 1 mm.
Figure 7
Figure 7. Regenerating CST axons after PTEN deletion form synapse-structures in spinal segments caudal to a crush injury
a,b, Sagittal sections from PTENf/f mice with AAV-Cre injection at P1, T8 spinal cord crush at the age of 6 weeks, BDA tracing at the age of 16 weeks and terminated at the age 18 weeks were analyzed for BDA (a) and vGlut1 (b) signals. Note that anti-vGlut1 antibodies label synaptic boutons of both CST axons and sensory axons, consistent with previous reports–. The asterisk marks the crush site. Scale bar: 200 μm. c–h, Representative examples of BDA-labeled boutons (c, f) co-localizing with anti-vGlut1 signals (d, g) and their merged images (e, h) from the gray matter of the spinal cord caudal to the crush site (squares in a). Scale bar: 5 μm. i, Frequencies of vGlut1+ boutons in BDA-labeled axons quantified mostly from the intermediate zone of the thoracic spinal cord gray matter in both intact control and PTENf/f with AAV-Cre mice. Both the BDA-labeled axonal lengths and the BDA+vGlut1+ boutons from 15 sections of 3 mice in each group were quantified. In crushed PTEN-deletion mice, we found BDA/vGlut1 co-labeled synapse approximately 60% as frequently as in intact control mice. Student’s t-test, P<0.05. Scale bar: 200μm (a, b) and bottom 5μm (c–h). j–l, Representative electron microscope images showing two synaptic structures formed by BDA-labeled axons (j, k) and a nearby unlabeled control synapse (l). In spinal neurons, the synaptic contact region often has patches of psd, which is the case in the synapse in k. In j, the psd is continuous between the arrows. sv: synaptic vesicle; psd: postsynaptic density.

Similar articles

Cited by

References

    1. Raineteau O, Schwab ME. Plasticity of motor systems after incomplete spinal cord injury. Nat Rev Neurosci. 2001;2:263–273. - PubMed
    1. Blesch A, Tuszynski MH. Spinal cord injury: plasticity, regeneration and the challenge of translational drug development. Trends Neurosci. 2009;32:41–47. - PubMed
    1. Zheng B, Lee JK, Xie F. Genetic mouse models for studying inhibitors of spinal axon regeneration. Trends Neurosci. 2006;29:640–646. - PubMed
    1. Deumens R, Koopmans GC, Joosten EA. Regeneration of descending axon tracts after spinal cord injury. Prog Neurobiol. 2005;77:57–89. - PubMed
    1. Thallmair M, Metz GA, Z’Graggen WJ, Raineteau O, Kartje GL, Schwab ME. Neurite growth inhibitors restrict plasticity and functional recovery following corticospinal tract lesions. Nat Neurosci. 1998;1:124–31. - PubMed

Publication types

MeSH terms

Substances