. 2010 Sep;11(9):862-71.
doi: 10.1038/ni.1917. Epub 2010 Aug 8.

Complement regulator CD46 temporally regulates cytokine production by conventional and unconventional T cells

Affiliations

Complement regulator CD46 temporally regulates cytokine production by conventional and unconventional T cells

John Cardone et al. Nat Immunol. 2010 Sep.

Abstract

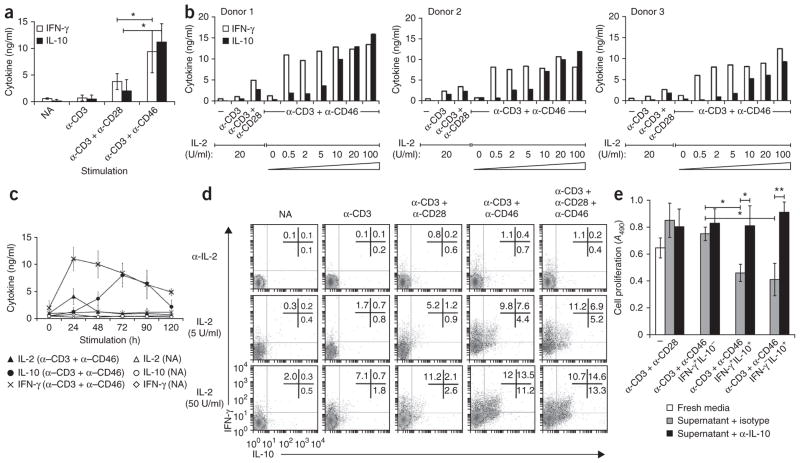
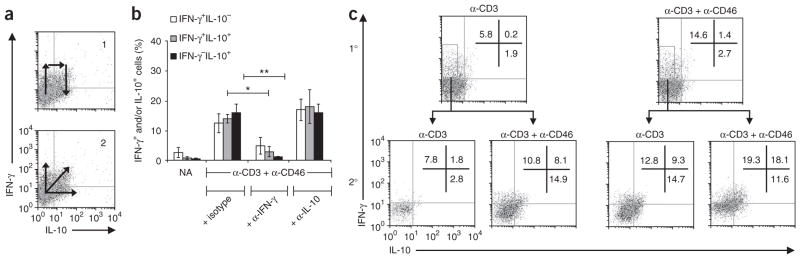
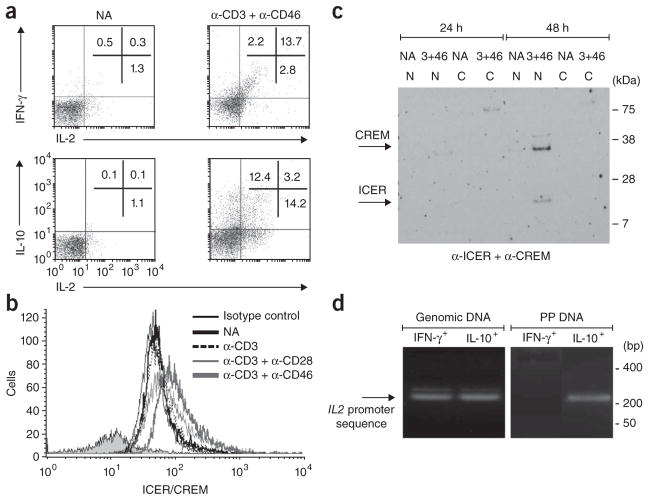
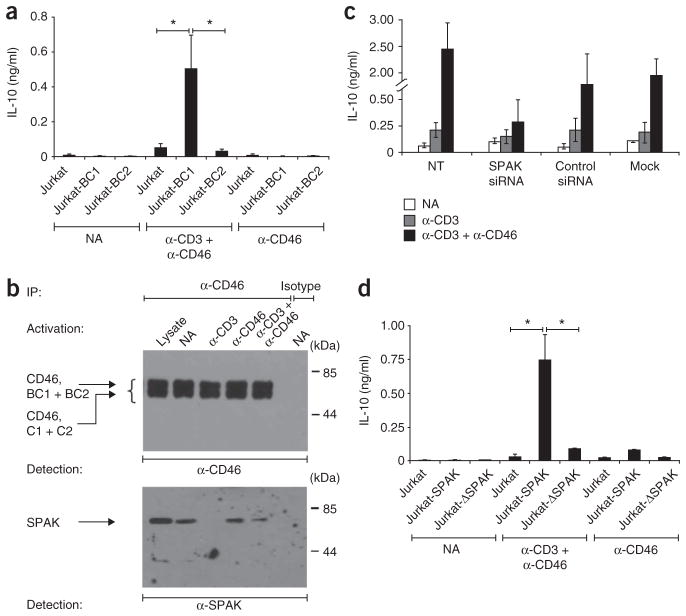
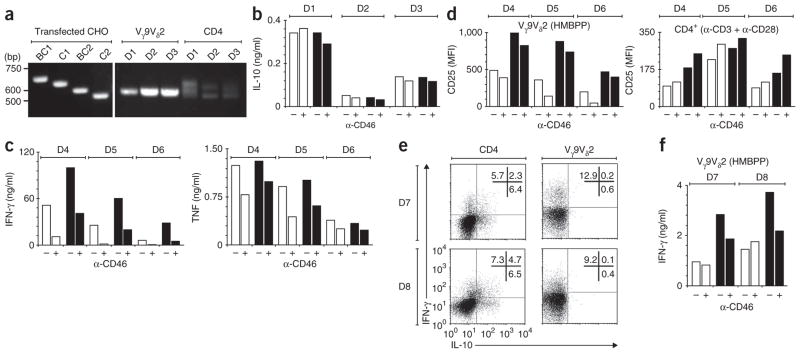
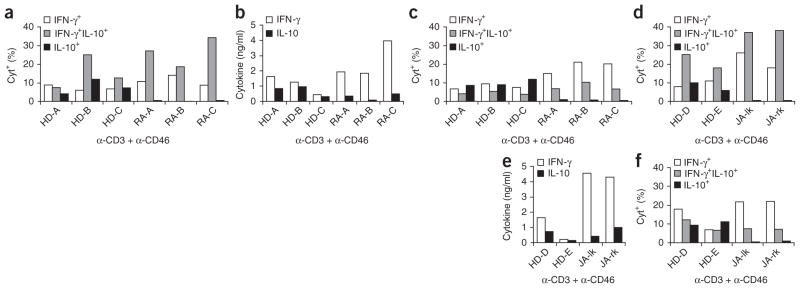
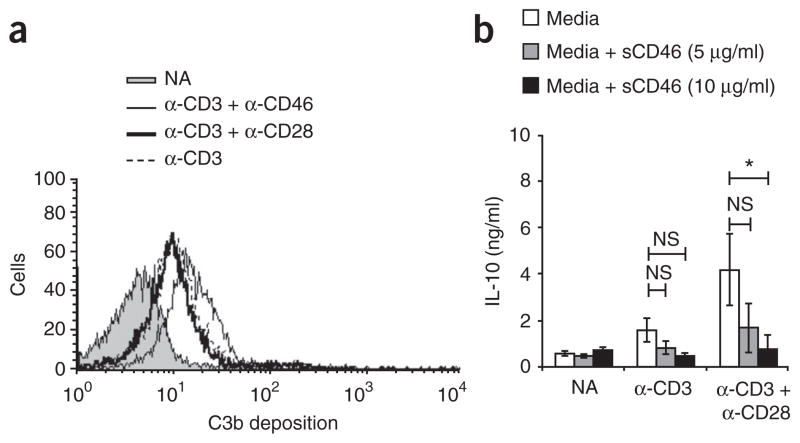
In this study we demonstrate a new form of immunoregulation: engagement on CD4(+) T cells of the complement regulator CD46 promoted the effector potential of T helper type 1 cells (T(H)1 cells), but as interleukin 2 (IL-2) accumulated, it switched cells toward a regulatory phenotype, attenuating IL-2 production via the transcriptional regulator ICER/CREM and upregulating IL-10 after interaction of the CD46 tail with the serine-threonine kinase SPAK. Activated CD4(+) T cells produced CD46 ligands, and blocking CD46 inhibited IL-10 production. Furthermore, CD4(+) T cells in rheumatoid arthritis failed to switch, consequently producing excessive interferon-gamma (IFN-gamma). Finally, gammadelta T cells, which rarely produce IL-10, expressed an alternative CD46 isoform and were unable to switch. Nonetheless, coengagement of T cell antigen receptor (TCR) gammadelta and CD46 suppressed effector cytokine production, establishing that CD46 uses distinct mechanisms to regulate different T cell subsets during an immune response.


Conflict of interest statement

COMPETING FINANCIAL INTERESTS

The authors declare no competing financial interests.

Figures

Figure 1
Figure 1
IL-2 regulates TH1 versus Tr1 effector function in CD4+ T cells activated with anti-CD3 and anti-CD46. (a) IFN-γ and IL-10 in supernatants of purified T cells not activated (NA) or activated for 72 h with various combinations of mAb to CD3 (α-CD3), mAb to CD28 (α-CD28) and mAb to CD46 (α-CD46; horizontal axis) plus IL-2 (25 U/ml). (b) IFN-γ and IL-10 in supernatants of purified T cells left unactivated (-) or activated for 72 h with various combinations of mAbs as in a plus various concentrations of IL-2 (wedge). (c) IL-2, IL-10 and IFN-γ in supernatants of purified T cells not activated or activated for 0–120 h (horizontal axis) with anti-CD3 plus anti-CD46 plus no exogenous IL-2 (IL-2 analysis) or IL-2 at 50 U/ml (IFN-γ or IL-10 analysis). (d) Cytokine secretion at 36 h by purified CD4+ T cells not activated or activated with various combinations of mAbs to CD3, CD28 and CD46 (above plots) plus IL-2 (dose, left margin) or neutralizing mAb to IL-2. Numbers in plots indicate percent IFN-γ+IL-10 cells (top left), IFN-γ+IL-10+ cells (top right) or IFN-γIL-10+ cells (bottom right). (e) Proliferation of freshly purified CD4+ T cells mixed with supernatants of T cells that were activated for 36 h with anti-CD3 and anti-CD46 in the presence of IL-2 (50 U/ml), separated by flow cytometry based on their secretion profile (IFN-γ+IL-10, IFN-γ+IL-10+ or IFN-γIL-10+) and cultured independently for further 18 h (low IL-2); the mixtures were activated with anti-CD3 plus anti-CD28 with neutralizing mAb to IL-10 (α-IL-10) or isotype-matched control antibody (isotype) and assessed at day 6 (middle and right). Far left (three bars), proliferation of freshly purified T cells activated with anti-CD3 and anti-CD28 in the presence of fresh media or supernatants of T cells activated for 72 h with anti-CD3 and anti-CD28. A490, absorbance at 490 nm. *P < 0.05 and **P < 0.01 (Student’s t-test). Data are representative of eight (a) or three (c,e) experiments (mean ± s.d.), eight experiments with three independent donors (b) or six experiments (d).
Figure 2
Figure 2
CD46–IL-2 signals induce a switch from a TH1 phenotype to a suppressive Tr1 phenotype in CD4+ T cells. (a) Flow cytometry of the induction of IL-10-secreting T cells by anti-CD46 from an initial TH1 effector cell (1) or from a distinct cell subset (2). (b) TH1 lineage induction in purified CD4+ T cells left not activated or activated with anti-CD3 and anti-CD46 plus IL-2 (50 U/ml IL-2) and isotype-matched control antibody or neutralizing mAb to IFN-γ or IL-10, presented as the percentage of cytokine-positive (Cyt+) cells: IFN-γ+IL-10, IFN-γ+IL-10+ or IFN-γIL-10+ (key). *P < 0.05 and **P < 0.01 (Student’s t-test). Data are representative of three experiments (mean ± s.d.). (c) Secretion of IFN-γ and IL-10 by IFN-γ+IL-10 cells isolated by flow cytometry from purified T cells activated for 36 h (primary stimulation (1°)) with anti-CD3 alone or with anti-CD3 and anti-CD46 in the presence of IL-2 (5 U/ml); the IFN-γ+IL-10 populations were expanded for 4 d with IL-2 (5 U/ml), then restimulated (above plots; secondary stimulation (2°)) and assayed 18 h later. Numbers in plots indicate percent IFN-γ+IL-10 cells (top left), IFN-γ+IL-10+ cells (top right) or IFN-γIL-10+ cells (bottom right). Data are representative of four experiments.
Figure 3
Figure 3
CD46-mediated signals contribute to the regulation of IL-2 expression by CD4+ T cells. (a) Secretion of IFN-γ, IL-10 and IL-2 by T cells either not activated or stimulated for 36 h with anti-CD3 and anti-CD46. Numbers in plots in top row indicate percent IFN-γ+IL-2 cells (top left), IFN-γ+IL-2+ cells (top right) or IFN-γIL-2+ cells (bottom right); numbers in bottom row indicate percent IL-10+IL-2 cells (top left), IL-10+IL-2+ cells (top right; also IFN-γ+ (data not shown)) or IL-10IL-2+ cells (bottom right). (b) Intracellular flow cytometry analysis of ICER/CREM expression after 36 h of no activation or activation with various combinations of mAbs to CD3, CD28 or CD46 (key) or isotype-matched control antibody (Isotype control). (c) Immunoblot analysis of the nuclear translocation of ICER/CREM, assessed in cytoplasmic (C) and nuclear (N) protein fractions of purified T cells either not activated or activated for 24 or 48 h with anti-CD3 and anti-CD46 (3+46). Right margin, molecular size in kilodaltons (kDa). (d) Chromatin-immunoprecipitation analysis of the binding of ICER/CREM to the IL2 promoter in IFN-γ+IL-10 cells (IFN-γ+) and IFN-γIL-10+ cells (IL-10+) induced with anti-CD3 and anti-CD46, presented as PCR amplification of an IL2 promoter–specific sequence from genomic DNA (control; left) or from DNA precipitated with anti-ICER/CREM (PP DNA; right). Right margin, size in base pairs (bp). Data are representative of three (a,b,d) or two (c) experiments.
Figure 4
Figure 4
The intracellular CYT-1 domain of CD46 and SPAK are required for IL-10 production in CD4+ T cells. (a) Secretion of IL-10 by Jurkat T cells stably transfected with the BC1 isoform (Jurkat-BC1) or BC2 isoform (Jurkat-BC2) of CD46 and either not activated or activated for 48 h with anti-CD3 and anti-CD46 or with anti-CD46 alone. (b) Immunoprecipitation (with a CD46-specific mAb or isotype-matched control mAb) of lysates of primary human CD4+ T cells activated for 15 min with various antibodies (above lanes), followed by immunoblot analysis with anti-CD46 (top) or anti-SPAK (bottom). Left margin: CD46, BC1 + BC2, CD46 isoform with BC region and either CYT-1 or CYT-2; CD46, C1 + C2, CD46 isoform with only the C region. Lysate (far left lane), untreated lysates from nonactivated cells (control). (c) IL-10 secretion by purified CD4+ T cells left untransfected (NT) or transfected with SPAK-specfic siRNA, nonspecific siRNA (Control) or buffer alone (Mock) and then either not activated or activated for 36 h with mAb to CD3 alone or mAb to CD3 and mAb to CD46 (key). (d) IL-10 production by Jurkat T cells left untransfected (Jurkat) or stably transfected with wild-type SPAK (Jurkat-SPAK) or a ‘kinase-dead’ version of SPAK (Jurkat-ΔSPAK) and either not activated or stimulated with anti-CD3 and anti-CD46 or with anti-CD46 alone. *P < 0.01 (Student’s t-test). Data are representative of three experiments (mean ± s.d. in a,c,d).
Figure 5
Figure 5
CD46 directly regulates γδ T cell function. (a) PCR analysis of CD46 isoform use by human γδ T cells (Vγ9Vδ2; middle) and CD4+ T cells (CD4; right) and in Chinese hamster ovary (CHO) cell lines transfected with single isoforms of CD46 (left). (bd) Production of IL-10 (b) and IFN-γ and tumor necrosis factor (TNF; c) by human γδ T cells among PBMCs stimulated with HMBPP (10 nM) with (+) or without (-) mAb to CD46 in the presence (filled bars) or absence (open bars) of IL-2 (100 U/ml). (d) CD25 expression by Vγ9Vδ2 T cells stimulated with HMBPP (10 nM) or CD4+ T cells stimulated with mAb to CD3 plus mAb to CD28, with or without mAb to CD46 and in the presence or absence of IL-2 (as in b,c). MFI, mean fluorescence intensity. (e) Flow cytometry of purified cultures of CD4+ or Vγ9Vδ2 T cells (both >97% pure) activated with mAb to CD3 or HMBPP, respectively, in the presence of mAb to CD46 and IL-2 (100 U/ml). Numbers in plots indicate percent IFN-γ+IL-10 cells (top left), IFN-γ+IL-10+ cells (top right) or IFN-γIL-10+ cells (bottom right). (f) Production of IFN-γ by purified Vγ9Vδ2 T cells with or without anti-CD46 treatment in the presence or absence of IL-2 (indicated as in b,c). D1–D8, donors 1–8. Data are representative of three experiments (ad) or one experiment each with six (e) or two (f) different donors.
Figure 6
Figure 6
CD4+ T cells from patients with rheumatoid arthritis are defective in the IFN-γ–IL-10 switch induced by anti-CD3 and anti-CD46. (a) Frequency of cytokine-secreting cells among blood-derived T cells obtained from three healthy donors (HD-A–HD-C) and three patients with rheumatoid arthritis (RA-A–RA-C) and activated for 36 h with anti-CD3 and anti-CD46 plus IL-2 (50 U/ml), presented as the percentage of cytokine-positive cells (key; middle value of two data points). (b) IFN-γ and IL-10 in supernatants of T cells activated as described in a and then maintained in culture for 5 d with IL-2 (50 U/ml). (c) Frequency of cytokine-secreting cells among cells treated as described in b, then restimulated for 8 h with anti-CD3 and anti-CD46 plus IL-2 (50 U/ml); results presented as in a. (d) Frequency of cytokine-secreting cells among T cells from the synovial fluid of the left knee (JA-lk) and right knee (JA-rk) of a patient with juvenile arthritis and blood-derived T cells from two healthy donors (HD-D and HD-E) after primary stimulation with anti-CD3 and anti-CD46; results presented as in a. (e) Secretion of IFN-γ and IL-10 by the cells in d during population expansion as described in b. (f) Frequency of cytokine-secreting cells among the cells in d after secondary stimulation as in c. Data are representative of two experiments (af).
Figure 7
Figure 7
Engagement of CD46 by locally produced C3b drives IL-10 expression in CD4+ T cells stimulated with anti-CD3 and anti-CD28. (a) Flow cytometry of C3b surface deposition on purified CD4+ T cells either not activated or activated for 12 h with immobilized mAbs (key). Data are representative of four experiments. (b) Production of IL-10 by purified T cells either not activated or activated for 36 h with mAb to CD3 alone or mAb to CD3 plus mAb to CD28 (horizontal axis) plus media alone or media plus soluble CD46 (sCD46; key). NS, not significant; *P < 0.01 (Student’s t-test). Data are representative of three experiments.

References

    1. Moore KW, de Waal Malefyt R, Coffman RL, O’Garra A. Interleukin-10 and the interleukin-10 receptor. Annu Rev Immunol. 2001;19:683–765. - PubMed
    1. Gazzinelli RT, et al. In the absence of endogenous IL-10, mice acutely infected with Toxoplasma gondii succumb to a lethal immune response dependent on CD4+ T cells and accompanied by overproduction of IL-12, IFN-γ and TNF-α. J Immunol. 1996;157:798–805. - PubMed
    1. O’Garra A, Vieira P. TH1 cells control themselves by producing interleukin-10. Nat Rev Immunol. 2007;7:425–428. - PubMed
    1. Kuhn R, Lohler J, Rennick D, Rajewsky K, Muller W. Interleukin-10-deficient mice develop chronic enterocolitis. Cell. 1993;75:263–274. - PubMed
    1. Franke A, et al. Sequence variants in IL10, ARPC2 and multiple other loci contribute to ulcerative colitis susceptibility. Nat Genet. 2008;40:1319–1323. - PubMed

Publication types