

Facile measurement of ¹H-¹5N residual dipolar couplings in larger perdeuterated proteins
- PMID: 20694505
- PMCID: PMC2950907
- DOI: 10.1007/s10858-010-9441-9
Facile measurement of ¹H-¹5N residual dipolar couplings in larger perdeuterated proteins
Abstract
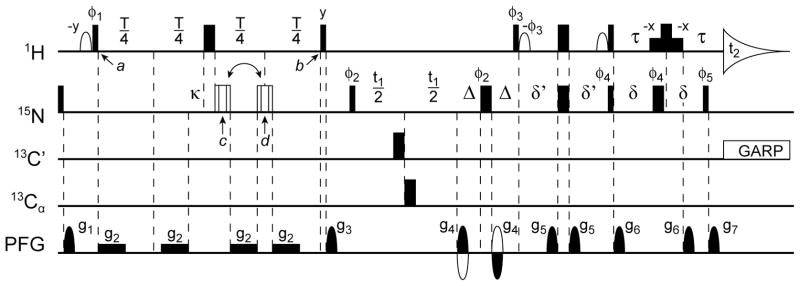
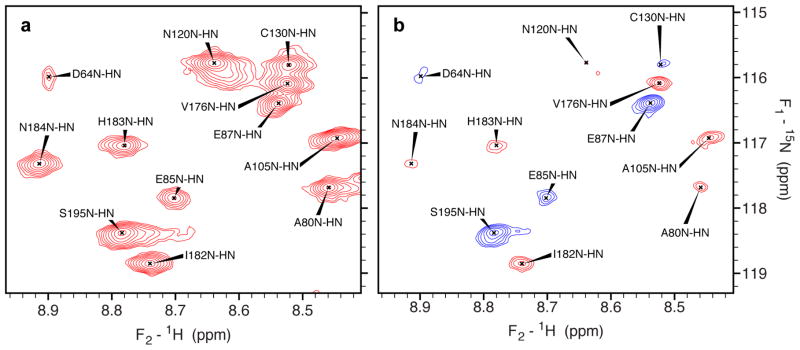
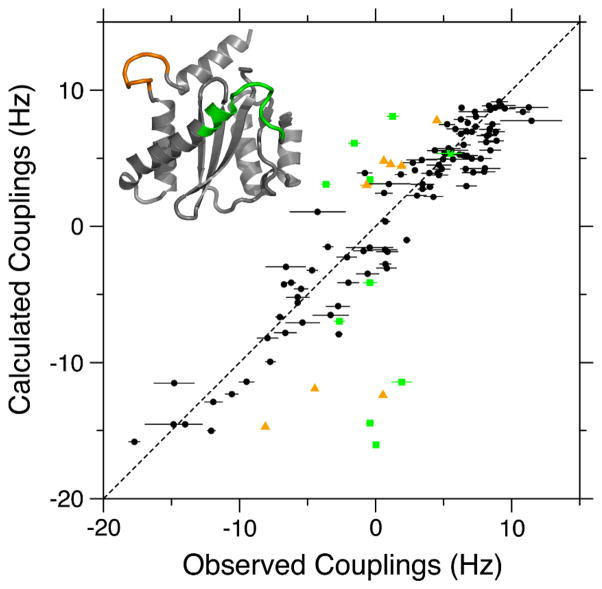
We present a simple method, ARTSY, for extracting ¹J(NH) couplings and ¹H-¹⁵N RDCs from an interleaved set of two-dimensional ¹H-¹⁵N TROSY-HSQC spectra, based on the principle of quantitative J correlation. The primary advantage of the ARTSY method over other methods is the ability to measure couplings without scaling peak positions or altering the narrow line widths characteristic of TROSY spectra. Accuracy of the method is demonstrated for the model system GB3. Application to the catalytic core domain of HIV integrase, a 36 kDa homodimer with unfavorable spectral characteristics, demonstrates its practical utility. Precision of the RDC measurement is limited by the signal-to-noise ratio, S/N, achievable in the 2D TROSY-HSQC spectrum, and is approximately given by 30/(S/N) Hz.
Figures
Similar articles
-
Measurement of (1)H-(15)N and (1)H-(13)C residual dipolar couplings in nucleic acids from TROSY intensities.J Biomol NMR. 2011 Sep;51(1-2):89-103. doi: 10.1007/s10858-011-9544-y. Epub 2011 Sep 27. J Biomol NMR. 2011. PMID: 21947918 Free PMC article.
-
Very large residual dipolar couplings from deuterated ubiquitin.J Biomol NMR. 2012 Sep;54(1):53-67. doi: 10.1007/s10858-012-9651-4. Epub 2012 Jul 25. J Biomol NMR. 2012. PMID: 22828737
-
MQ-HNCO-TROSY for the measurement of scalar and residual dipolar couplings in larger proteins: application to a 557-residue IgFLNa16-21.J Biomol NMR. 2010 Jul;47(3):183-94. doi: 10.1007/s10858-010-9422-z. Epub 2010 May 8. J Biomol NMR. 2010. PMID: 20454834
-
Homonuclear decoupling for enhancing resolution and sensitivity in NOE and RDC measurements of peptides and proteins.J Magn Reson. 2014 Apr;241:97-102. doi: 10.1016/j.jmr.2013.11.006. Epub 2013 Nov 22. J Magn Reson. 2014. PMID: 24360766 Free PMC article. Review.
-
Advances in NMR Spectroscopy of Weakly Aligned Biomolecular Systems.Chem Rev. 2022 May 25;122(10):9307-9330. doi: 10.1021/acs.chemrev.1c00730. Epub 2021 Nov 12. Chem Rev. 2022. PMID: 34766756 Review.
Cited by
-
Evidence that the TRPV1 S1-S4 membrane domain contributes to thermosensing.Nat Commun. 2020 Aug 20;11(1):4169. doi: 10.1038/s41467-020-18026-2. Nat Commun. 2020. PMID: 32820172 Free PMC article.
-
Automated NMR resonance assignments and structure determination using a minimal set of 4D spectra.Nat Commun. 2018 Jan 26;9(1):384. doi: 10.1038/s41467-017-02592-z. Nat Commun. 2018. PMID: 29374165 Free PMC article.
-
Determination of the structures of symmetric protein oligomers from NMR chemical shifts and residual dipolar couplings.J Am Chem Soc. 2011 Apr 27;133(16):6288-98. doi: 10.1021/ja111318m. Epub 2011 Apr 5. J Am Chem Soc. 2011. PMID: 21466200 Free PMC article.
-
Dynamics of protein kinases: insights from nuclear magnetic resonance.Acc Chem Res. 2015 Apr 21;48(4):1106-14. doi: 10.1021/acs.accounts.5b00001. Epub 2015 Mar 24. Acc Chem Res. 2015. PMID: 25803188 Free PMC article.
-
Applications of NMR to structure determination of RNAs large and small.Arch Biochem Biophys. 2017 Aug 15;628:42-56. doi: 10.1016/j.abb.2017.06.003. Epub 2017 Jun 16. Arch Biochem Biophys. 2017. PMID: 28600200 Free PMC article. Review.
References
-
- Bax A, Grishaev A. Weak alignment NMR: a hawk-eyed view of biomolecular structure. Curr Opin Struct Biol. 2005;15:563–570. - PubMed
-
- Bax A, Vuister GW, Grzesiek S, Delaglio F, Wang AC, Tschudin R, Zhu G. Measurement of homo- and heteronuclear J couplings from quantitative J correlation. Meth Enzymol. 1994;239:79–125. - PubMed
Publication types
MeSH terms
Substances
Grants and funding
LinkOut - more resources
Full Text Sources
