

Role of EUS-FNA-based cytology in the diagnosis of mucinous pancreatic cystic lesions: a systematic review and meta-analysis
- PMID: 20694512
- PMCID: PMC4169146
- DOI: 10.1007/s10620-010-1361-8
Role of EUS-FNA-based cytology in the diagnosis of mucinous pancreatic cystic lesions: a systematic review and meta-analysis
Abstract
Background: Preoperative diagnosis of malignancy in pancreatic cystic lesions (PCLs) remains challenging. Most non-mucinous cystic lesions (NMCLs) are benign, but mucinous cystic lesions (MCLs) are more likely to be premalignant or malignant.
Aim: The aim of this study was to assess the sensitivity, specificity, and positive and negative likelihood ratios (LRs) of EUS-FNA-based cytology in differentiating MCLs from non-mucinous PCLs.
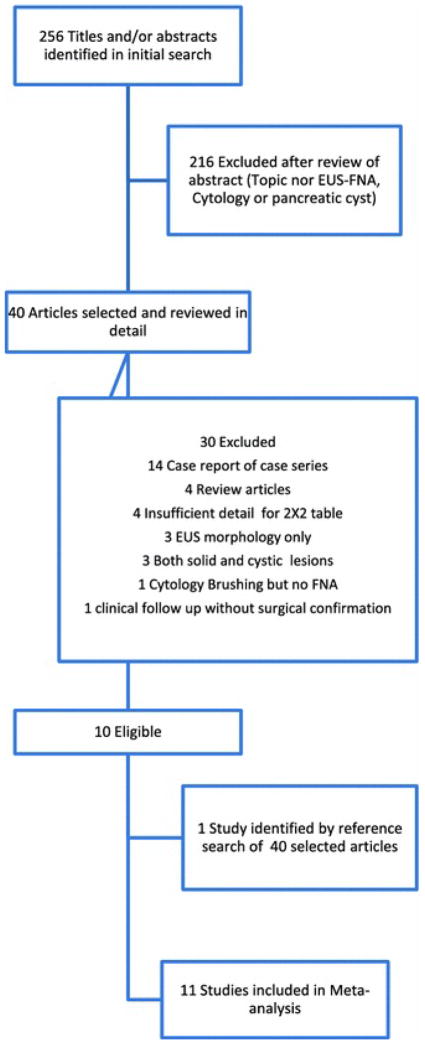
Methods: We conducted a comprehensive search of MEDLINE, SCOPUS, Cochrane, and "CINAHL Plus" databases to identify studies, in which the results of EUS-FNA-based cytology of PCLs were compared with those of surgical biopsy or surgical excision histopathology. A DerSimonian-Laird random effect model was used to estimate the pooled sensitivity, specificity, and LRs, and a summary receiver-operating characteristic (SROC) curve was constructed.
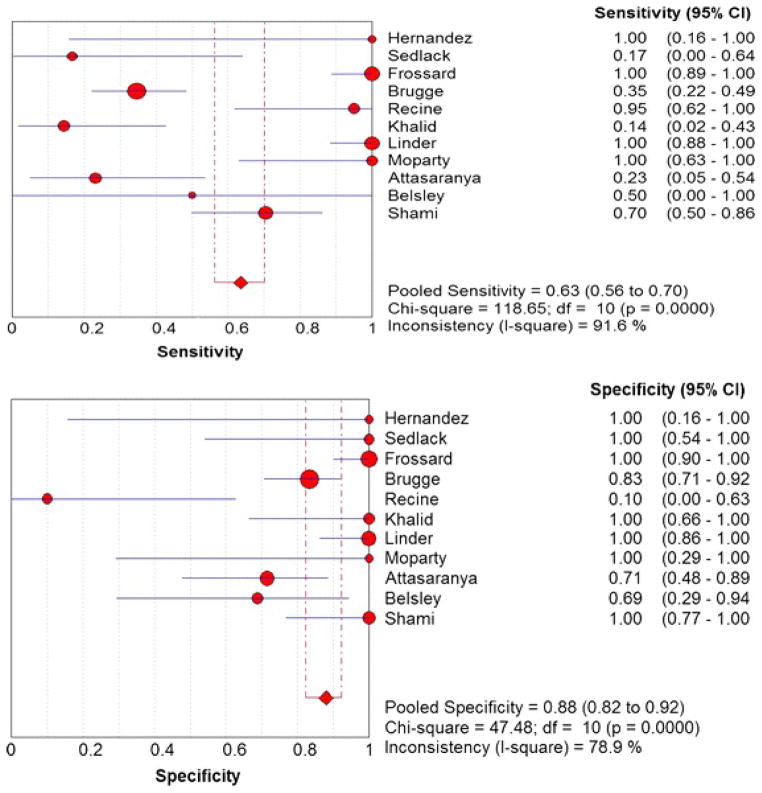
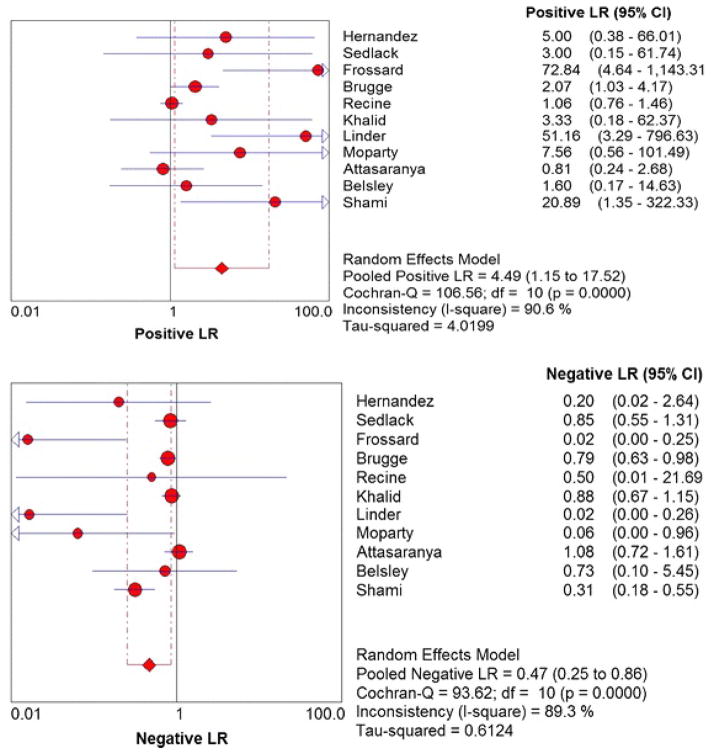
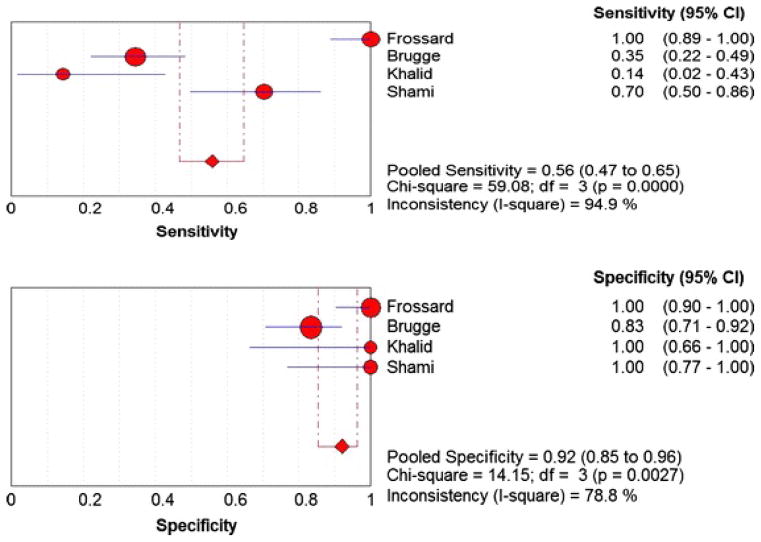
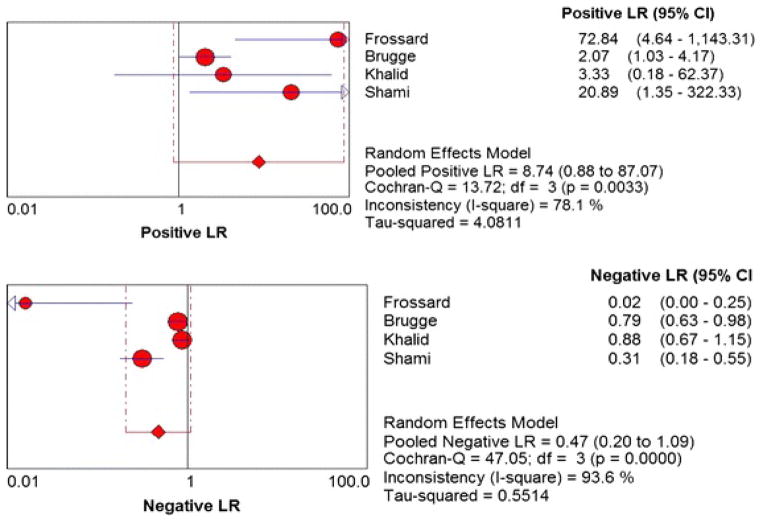
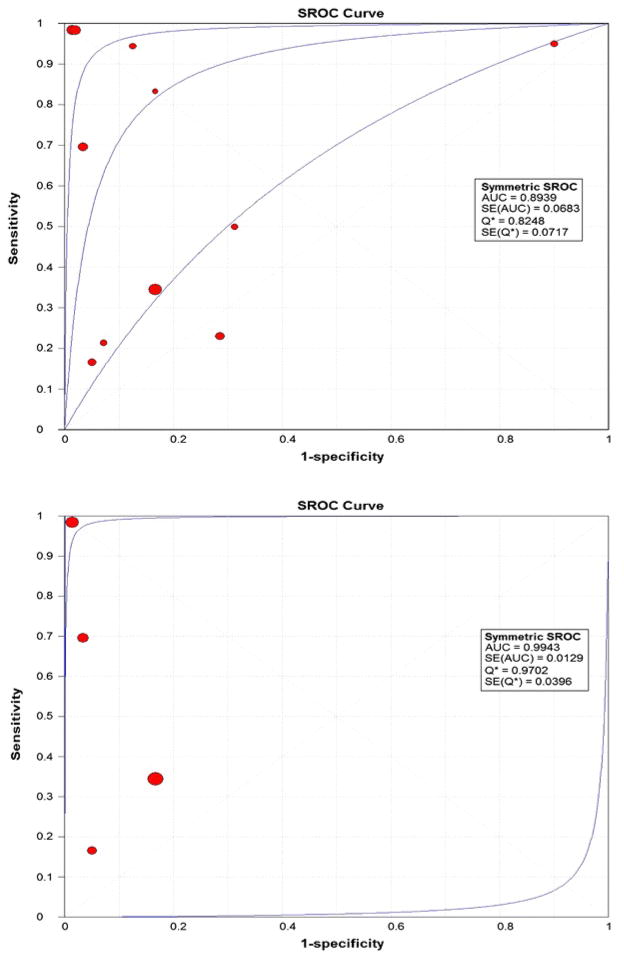
Results: We included 376 patients from 11 distinct studies who underwent EUS-FNA-based cytology and also had histopathological diagnosis. The pooled sensitivity and specificity in diagnosing MCLs were 0.63 (95% CI, 0.56-0.70) and 0.88 (95% CI, 0.83-0.93), respectively. The positive and negative LRs in diagnosing MCLs were 4.46 (95% CI, 1.21-16.43) and 0.46 (95% CI, 0.25-0.86), respectively. The area under the curve (AUC) was 0.89.
Conclusions: EUS-FNA-based cytology has overall low sensitivity but good specificity in differentiating MCLs from NMCLs. Further research is required to improve the overall sensitivity of EUS-FNA-based cytology to diagnose MCLs while evaluating PCL.
Figures
Similar articles
-
Imaging modalities for characterising focal pancreatic lesions.Cochrane Database Syst Rev. 2017 Apr 17;4(4):CD010213. doi: 10.1002/14651858.CD010213.pub2. Cochrane Database Syst Rev. 2017. PMID: 28415140 Free PMC article.
-
Diagnostic yield of EUS-FNA-based cytology distinguishing malignant and benign IPMNs: a systematic review and meta-analysis.Pancreatology. 2014 Sep-Oct;14(5):380-4. doi: 10.1016/j.pan.2014.07.006. Epub 2014 Jul 22. Pancreatology. 2014. PMID: 25278308
-
Endoscopic Ultrasound-Guided Confocal Laser Endomicroscopy Increases Accuracy of Differentiation of Pancreatic Cystic Lesions.Clin Gastroenterol Hepatol. 2020 Feb;18(2):432-440.e6. doi: 10.1016/j.cgh.2019.06.010. Epub 2019 Jun 18. Clin Gastroenterol Hepatol. 2020. PMID: 31220640
-
Transabdominal ultrasound and endoscopic ultrasound for diagnosis of gallbladder polyps.Cochrane Database Syst Rev. 2018 Aug 15;8(8):CD012233. doi: 10.1002/14651858.CD012233.pub2. Cochrane Database Syst Rev. 2018. PMID: 30109701 Free PMC article.
-
Risk of Pancreatitis After Endoscopic Ultrasound-Guided Fine-Needle Aspiration of Pancreatic Cystic Lesions: A Systematic Review and Meta-Analysis.Am J Gastroenterol. 2024 Nov 1;119(11):2174-2186. doi: 10.14309/ajg.0000000000002942. Epub 2024 Jul 5. Am J Gastroenterol. 2024. PMID: 38976379
Cited by
-
Pancreatic cystic neoplasms: Review of current knowledge, diagnostic challenges, and management options.J Carcinog. 2015 Mar 14;14:3. doi: 10.4103/1477-3163.153285. eCollection 2015. J Carcinog. 2015. PMID: 25821410 Free PMC article. Review.
-
Clinical Perspectives on the Histomolecular Features of the Pancreatic Precursor Lesions: A Narrative Review.Middle East J Dig Dis. 2024 Jul;16(3):136-146. doi: 10.34172/mejdd.2024.387. Epub 2024 Jul 31. Middle East J Dig Dis. 2024. PMID: 39386334 Free PMC article. Review.
-
In vivo characterization of pancreatic cystic lesions by needle-based confocal laser endomicroscopy (nCLE): proposition of a comprehensive nCLE classification confirmed by an external retrospective evaluation.Surg Endosc. 2016 Jun;30(6):2603-12. doi: 10.1007/s00464-015-4510-5. Epub 2015 Oct 1. Surg Endosc. 2016. PMID: 26428198
-
Endoscopic ultrasound-guided fine-needle aspiration for pancreatic cystic lesions: a comprehensive review.J Med Ultrason (2001). 2024 Apr;51(2):219-226. doi: 10.1007/s10396-023-01389-6. Epub 2023 Dec 5. J Med Ultrason (2001). 2024. PMID: 38051460 Review.
-
Improving the yield of EUS-guided histology.Endosc Ultrasound. 2018 Sep-Oct;7(5):301-305. doi: 10.4103/eus.eus_45_18. Endosc Ultrasound. 2018. PMID: 30323157 Free PMC article. No abstract available.
References
-
- Box JC, Douglas HO. Management of cystic neoplasms of the pancreas. Am Surg. 2000;66(5):495–501. - PubMed
-
- Fernandez-del Castillo C, Warshaw AL. Cystic tumors of the pancreas. Surg Clin North Am. 1995;75(5):1001–16. - PubMed
-
- Steinberg W, Tenner S. Acute pancreatitis. N Engl J Med. 1994;330(17):1198–210. - PubMed
Publication types
MeSH terms
Grants and funding
LinkOut - more resources
Full Text Sources
Medical
