. 2010 Aug;68(2):264-9.
doi: 10.1002/ana.22036.

Residual tumor cells are unique cellular targets in glioblastoma

Affiliations

Residual tumor cells are unique cellular targets in glioblastoma

Martin Glas et al. Ann Neurol. 2010 Aug.

Abstract

Residual tumor cells remain beyond the margins of every glioblastoma (GBM) resection. Their resistance to postsurgical therapy is considered a major driving force of mortality, but their biology remains largely uncharacterized. In this study, residual tumor cells were derived via experimental biopsy of the resection margin after standard neurosurgery for direct comparison with samples from the routinely resected tumor tissue. In vitro analysis of proliferation, invasion, stem cell qualities, GBM-typical antigens, genotypes, and in vitro drug and irradiation challenge studies revealed these cells as unique entities. Our findings suggest a need for characterization of residual tumor cells to optimize diagnosis and treatment of GBM.


Conflict of interest statement

Potential Conflicts of Interest

Nothing to report.

Figures

FIGURE 1
FIGURE 1
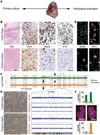
Characterization of tumor tissue and primary cells. (A) Representative fragments of tissue biopsies were allocated equally for histological analysis and for in vitro derivation of primary cultures. (B–F) Patient 023 results are shown. (B) Vascular proliferation and characteristic necrosis (hematoxylin and eosin [H&E]), pleomorphic glial tumor cells (glial fibrillary acidic protein [GFAP], microtubule-associated protein 2c [Map2c]), and an abundance of mitotic/proliferative activity (Ki67) are characteristics of a glioblastoma (GBM) (upper panel). In contrast, increased cellular density, abnormal grouping of cells with occasional mitotic figures (H&E), reactive gliosis (GFAP), and few actively proliferating (Ki67) tumor cells (Map2c) are characteristics of infiltrated surrounding parenchyma (lower panel). Note that for immunohistochemistry (GFAP, Map2c, Ki67), antigens were detected using standard diaminobenzidine reaction (brown). (C) Single nucleotide polymorphism (SNP)-based genotyping demonstrated largely overlapping profiles of GBM-typical alterations in paired cultures. In the presented case, gain of chromosome 7 (upward arrowheads), loss of heterozygosity (LOH) of chromosome 10 (downward arrowheads), and focal amplifications of CDK4 and MDM2 on chromosome 12 (boxed area) were noted. Always, however, minor genomic alterations distinguished paired cultures from each other. In the presented case, the detected chromosome 10 LOH was copy-neutral only in cells from the routinely resected tissue (asterisk in upper panel). (D) Phase contrast of the #023 primary cultures at passage 7 (left). SNP-genotyping data of chromosome 12 highlight the amplifications of the CDK4 and MDM2 loci used in this case to determine the frequency of patient-specific GBM cells in vitro and in vivo. (E) Fluorescence in situ hybridization (insets, specific gene probe in red; centromer probe chromosome 12 in green) revealed the presence and enrichment of patient-specific cells in vitro (top graph, center biopsy; bottom graph, periphery biopsy). Both alterations were present in 100 (±0)% of the cells from center and periphery cultures. (F) In contrast, the parental tissue revealed a frequency of only 73 (±1.3)% (center) versus 12 (±1.6)% (periphery) MDM2-/CDK4-amplified tumor nuclei, respectively. Scale bars: (B) H&E, 200µm; GFAP/Map2c/Ki67, 50µm; (D) 30µm; (E) 15µm.
FIGURE 2
FIGURE 2
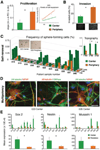
Regional distribution of stem/progenitor cells. (A) In vitro analysis of proliferation kinetics revealed linear expansion rates between culture passages 5 and 10 for all primary cultures investigated. The inset specifies the performance of the paired #023 samples. Slope analysis, however, demonstrated a significant difference between slower proliferating center cells and more rapidly expanding residual cells derived from periphery biopsies. Mean values of center (0.06 ± 0.02) and periphery-derived residual cell culture (0.15 ± 0.03) slopes indicated >2× faster proliferating residual cells (n = 8; *p < 0.05). (B) The Matrigel assay showed a significantly higher invasion ratio for the periphery biopsy-derived residual cells compared to their paired center-derived samples. The mean invasion rates for center and residual cell cultures were 14% ± 3% versus 34% ± 7%, respectively (n = 3; *p < 0.05). The photographs depict DAPI (4′,6-diamidino-2-phenylindole)–stained cell nuclei on the bottoms of the membranes (case 023). (C) The neurosphere (NS) assay was applied to cells from periphery-derived residual cells and center biopsies at culture passage 5. The appearance of representative primary neurospheres at 3 weeks in culture is shown (insets, left). Individual ratios of neurosphere-forming cells are presented in the graph. With the exception of periphery sample #046, cases shown to generate 2° neurospheres continued to form 3° and higher degree neurospheres (not shown). Mean data analysis revealed among glioblastoma center cells a significantly higher ratio of continuously selfrenewing (stem) cells (inset, right, *p < 0.05). (D) Plating and differentiation of cells from 2°/3° neurospheres always resulted in glial fibrillary acidic protein (GFAP)-expressing astrocytes, βIII tubulin-expressing neurons, and 2′3′cyclic nucleotide 3′ phosphohydrolase (CNPase)+ oligodendrocytes. Note that many neurosphere-derived cells demonstrated coexpression of GFAP and βIII tubulin. (E) Quantitative reverse transcriptase-polymerase chain reaction (qRT-PCR) data demonstrate the levels of neural stem/progenitor-typical transcripts Sox2, Nestin, and Musashi-1 in a series of paired culture samples (upper graphs). Lower graphs represent mean data of the respective markers (*p < 0.05). For presentation in (E), original data were multiplied by a factor of 104. Scale bars: (C) 200µm; (D) 50µm. PD = population doublings of propagated cultures; dic = days in culture (for further details please refer to the Supplemental Methods).
FIGURE 3
FIGURE 3
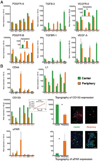
Molecular marker analysis. (A) Quantitative reverse transcriptase-polymerase chain reaction (qRT-PCR) data demonstrate levels (mean normalized) of a selection of currently investigated molecular targets in the field of neuro-oncology from a set of 6 paired culture samples (at culture passage 5). In 23/36 comparative measurements, mRNA expression levels varied >50% between center and periphery biopsy-derived cells of the same patient (indicated in red). Note the regional distribution (topography) of vascular endothelial growth factor receptor (VEGFR)-2 and platelet-derived growth factor receptor (PDGFR)-B (*p < 0.05). (B) qRT-PCR data show individual levels (mean normalized) of cell surface markers that have been implied as significant for the study of glioblastoma (GBM) initiation, maintenance, and/or spread., In 20/24 comparative measurements, mRNA expression levels varied >50% between center and periphery biopsy-derived residual cells of the same patient (indicated in red). Note the regional distribution (topography) of CD133 and urokinase plasminogen activator receptor (uPAR) (*p < 0.05). The insets show representative immunofluorescence photographs of CD133+ (red) and uPAR+ (green) cells. uPAR has been shown in several types of human cancer, including glioma, to be correlated with increased cell proliferation, invasion, and resistance to chemotherapy. CD133 is an epitope that can be present on cancerous (glioma) stem cells and that can indicate radiotherapy-resistant cell populations of GBM.,, Coherence of qRT-PCR data was verified with flow cytometry analysis (see inset, CD133 graph). (A, B) For presentation, original data were multiplied by a factor of 103/105/106 as indicated on the y axis. (B) Scale bars: 20µm. TGFBR = transforming growth factor-beta receptor.

References

    1. Mitchell P, Ellison DW, Mendelow AD. Surgery for malignant gliomas: mechanistic reasoning and slippery statistics. Lancet Neurol. 2005;4:413–422. - PubMed
    1. Stupp R, Mason WP, van den Bent MJ, et al. Radiotherapy plus concomitant and adjuvant temozolomide for glioblastoma. N Engl J Med. 2005;352:987–996. - PubMed
    1. Stummer W, Pichlmeier U, Meinel T, et al. Fluorescence-guided surgery with 5-aminolevulinic acid for resection of malignant glioma: a randomised controlled multicentre phase III trial. Lancet Oncol. 2006;7:392–401. - PubMed
    1. Rao JS. Molecular mechanisms of glioma invasiveness: the role of proteases. Nat Rev Cancer. 2003;3:489–501. - PubMed
    1. Singh SK, Hawkins C, Clarke ID, et al. Identification of human brain tumour initiating cells. Nature. 2004;432:396–401. - PubMed

Publication types

MeSH terms

Substances