Comparative Study
. 2011 Jun;23(6):1507-21.
doi: 10.1162/jocn.2010.21534. Epub 2010 Aug 9.

Neural activity in frontal cortical cell layers: evidence for columnar sensorimotor processing

Affiliations
Comparative Study

Neural activity in frontal cortical cell layers: evidence for columnar sensorimotor processing

Ioan Opris et al. J Cogn Neurosci. 2011 Jun.

Abstract

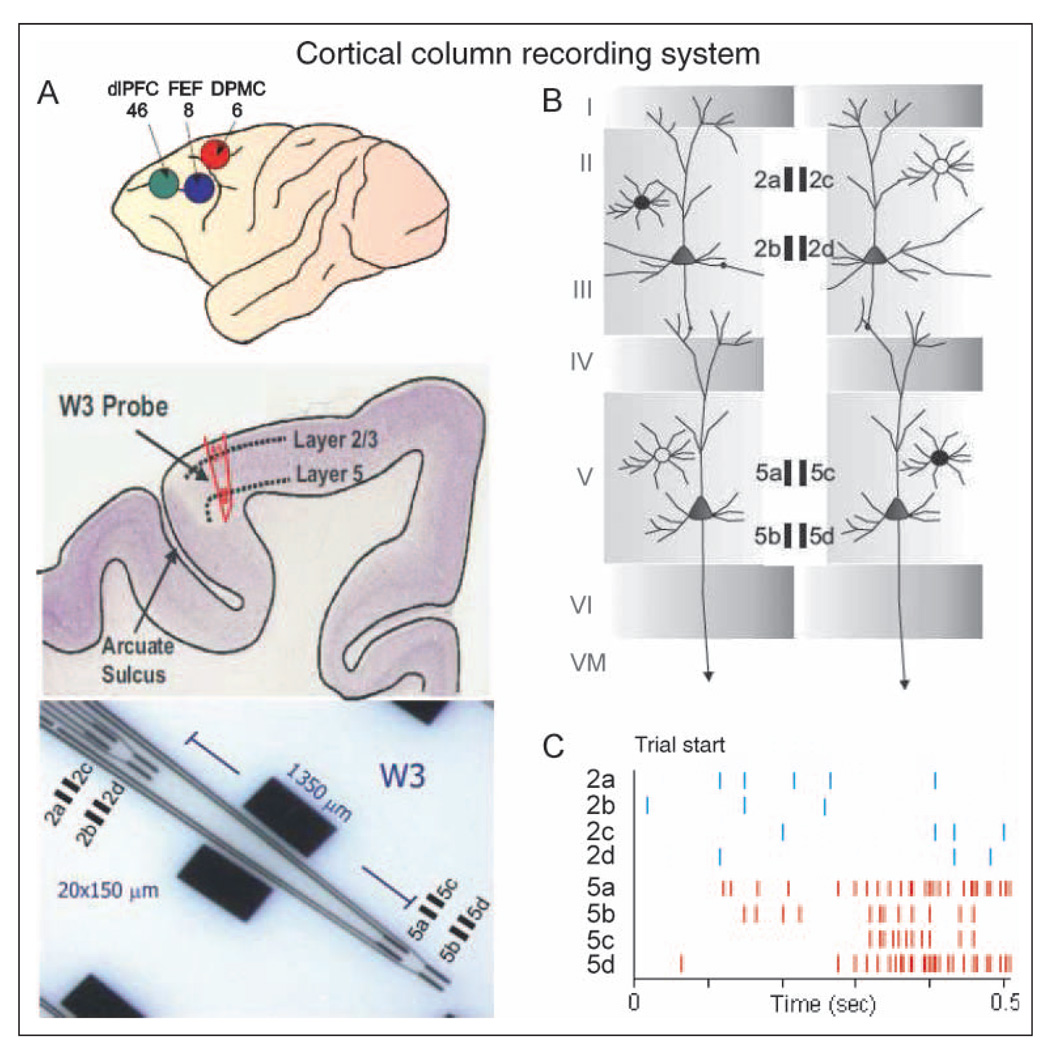
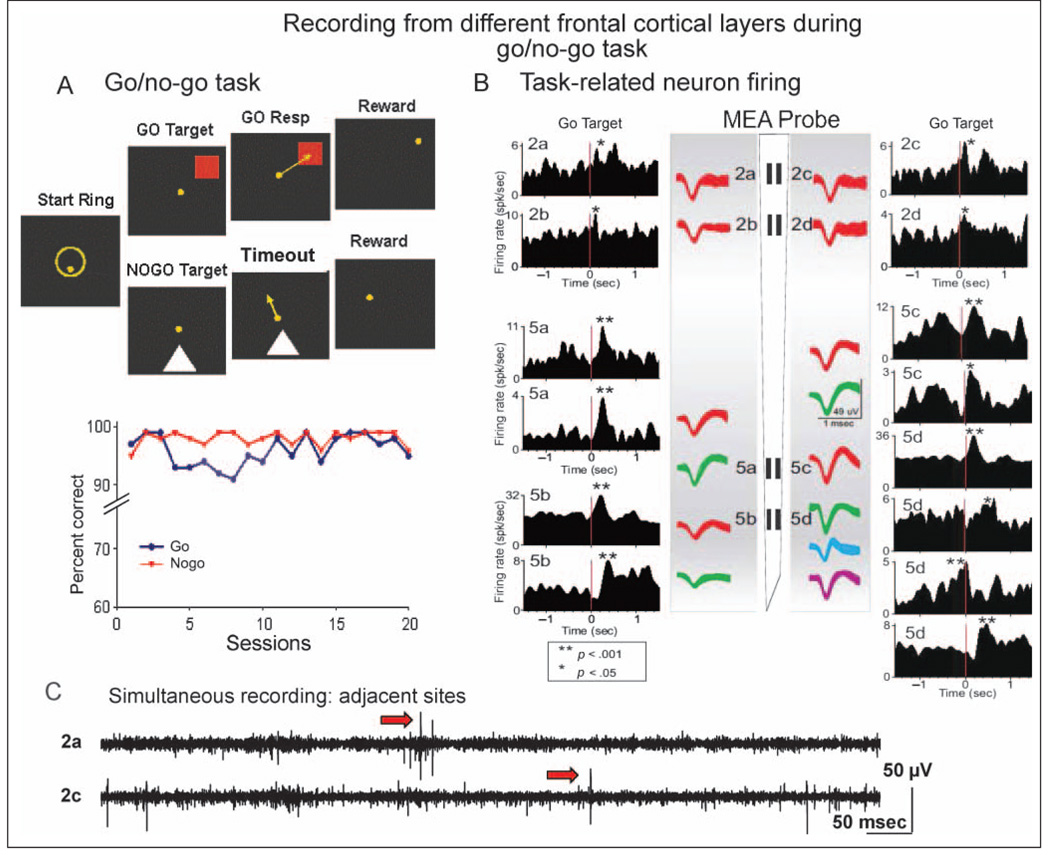
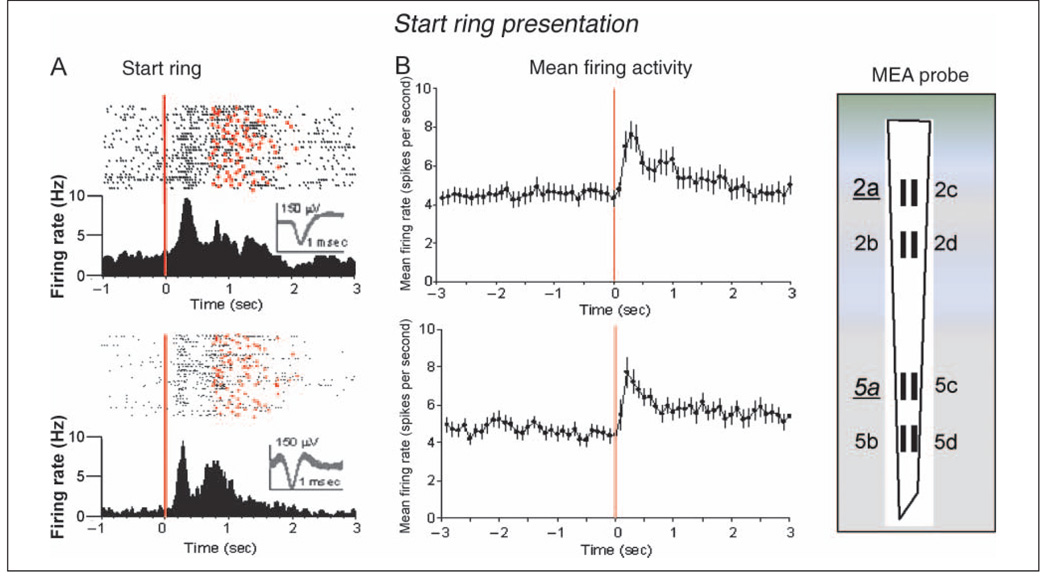
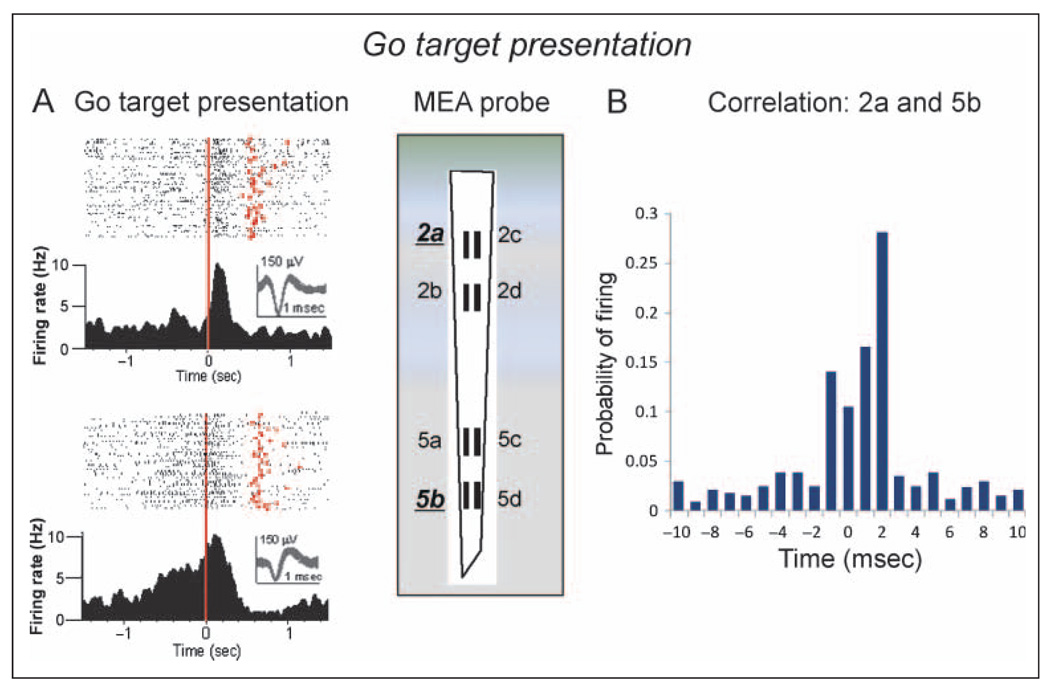
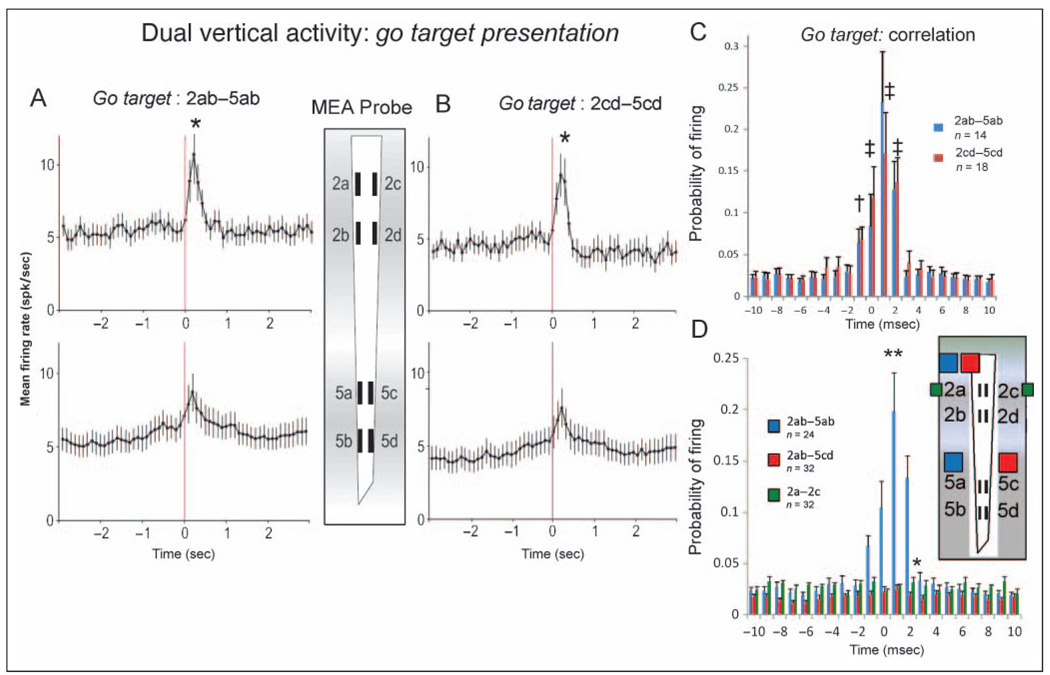
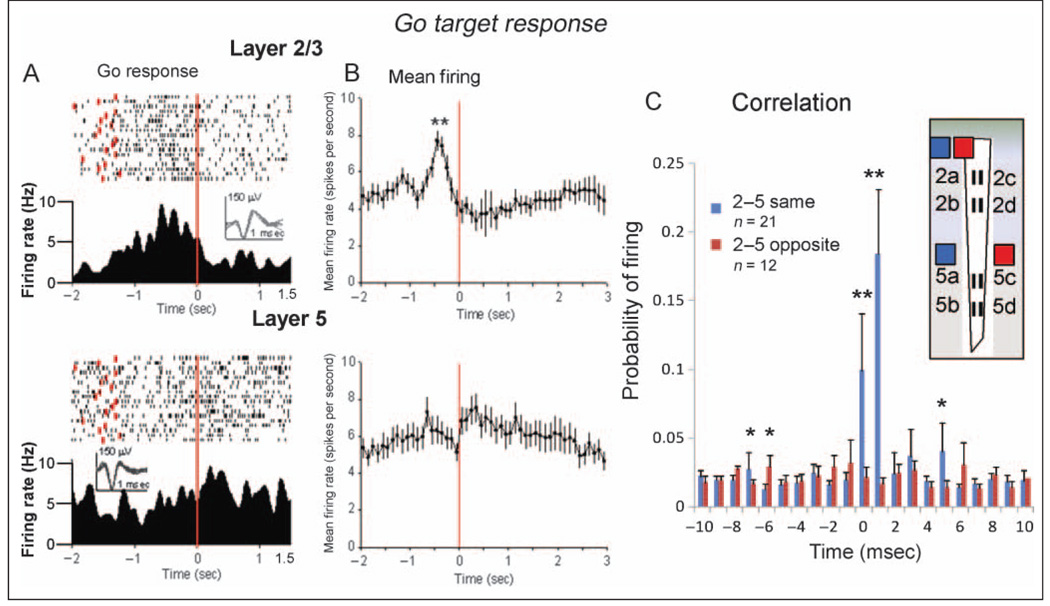
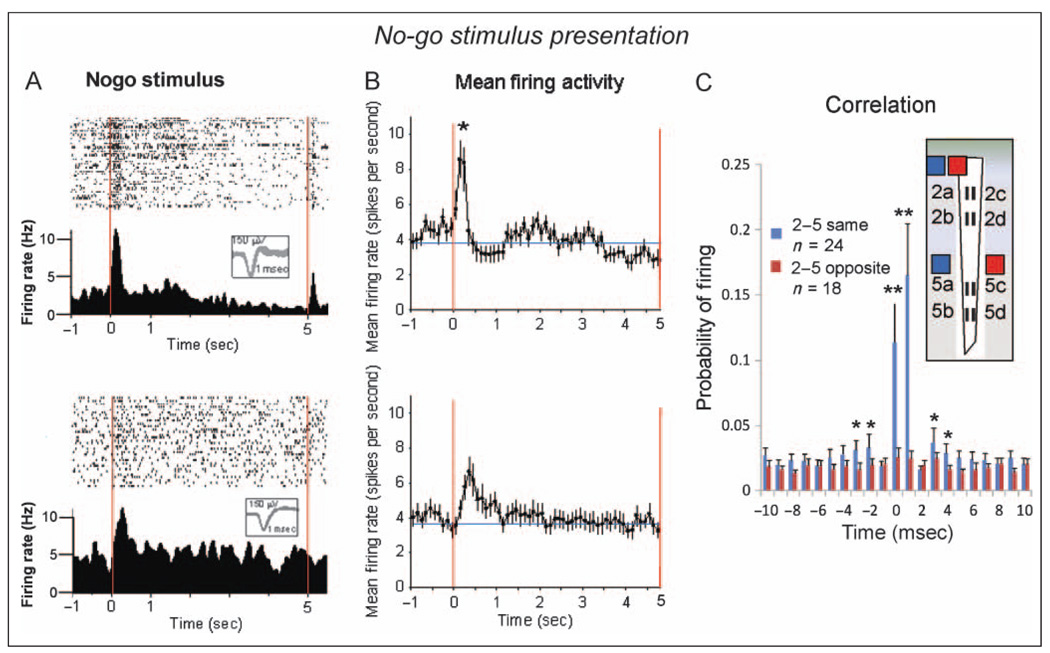
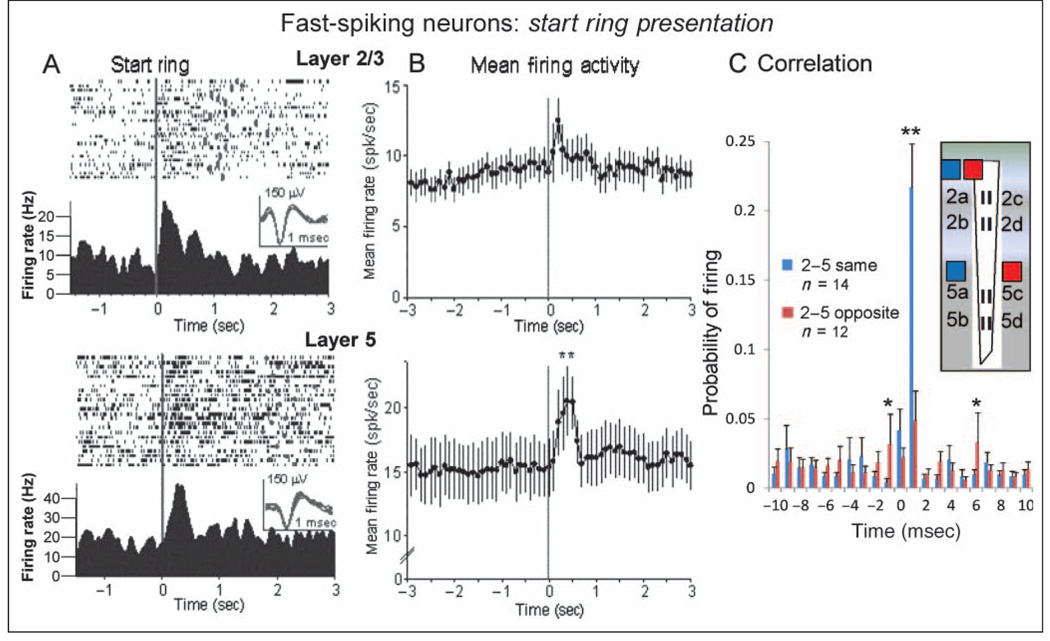
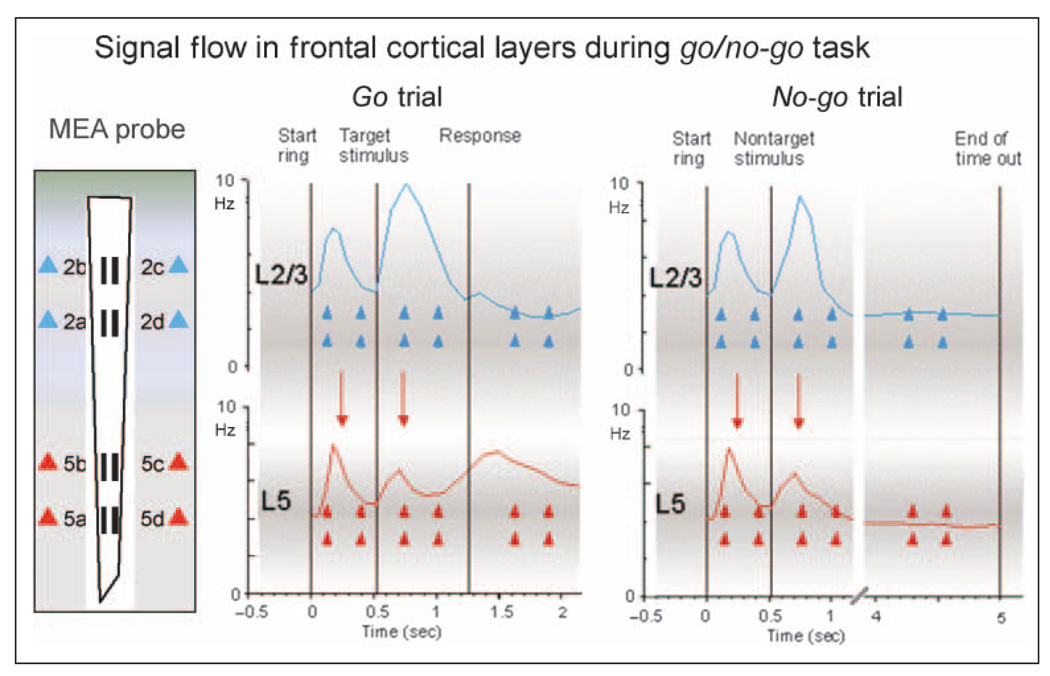
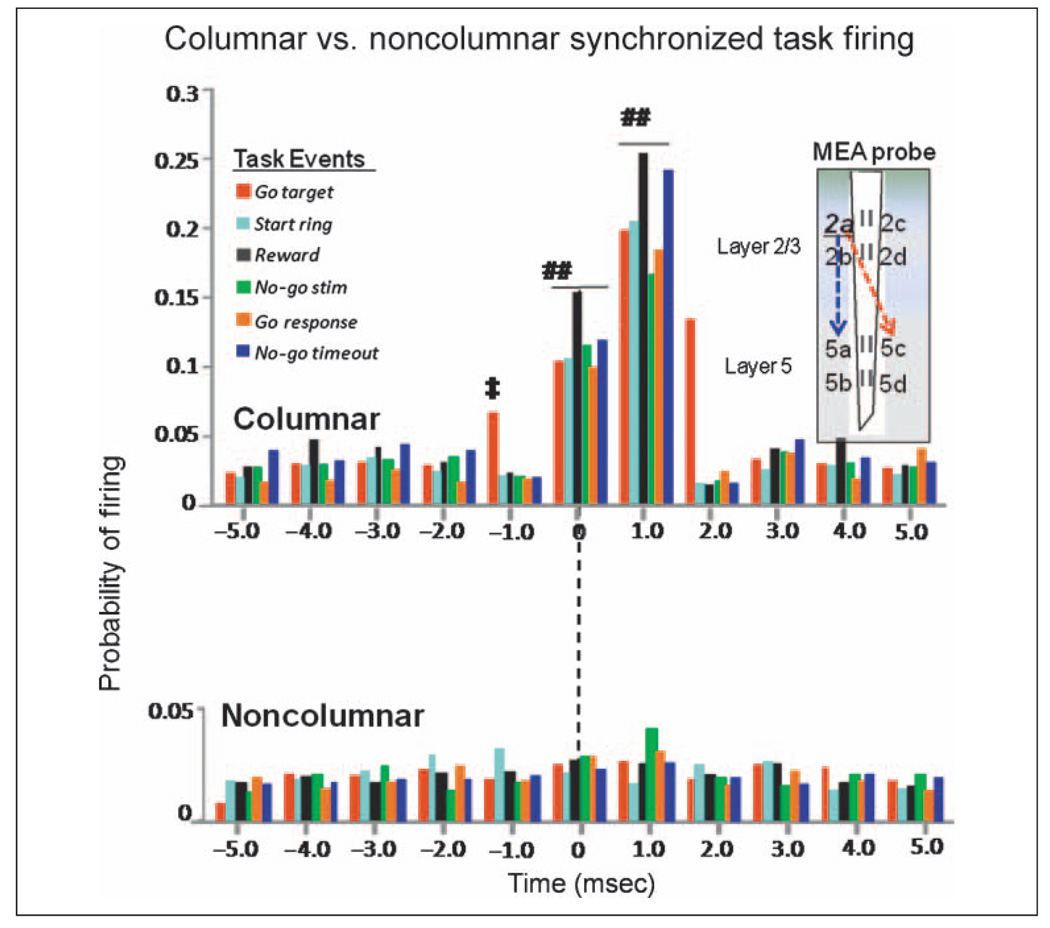
The mammalian frontal cortex (FCx) is at the top of the brain's sensorimotor hierarchy and includes cells in the supragranular Layer 2/3, which integrate convergent sensory information for transmission to infragranular Layer 5 cells to formulate motor system outputs that control behavioral responses. Functional interaction between these two layers of FCx was examined using custom-designed ceramic-based microelectrode arrays (MEAs) that allowed simultaneous recording of firing patterns of FCx neurons in Layer 2/3 and Layer 5 in nonhuman primates performing a simple go/no-go discrimination task. This unique recording arrangement showed differential encoding of task-related sensory events by cells in each layer with Layer 2/3 cells exhibiting larger firing peaks during presentation of go target and no-go target task images, whereas Layer 5 cells showed more activity during reward contingent motor responses in the task. Firing specificity to task-related events was further demonstrated by synchronized firing between pairs of cells in different layers that occupied the same vertically oriented "column" on the MEA. Pairs of cells in different layers recorded at adjacent "noncolumnar" orientations on the MEA did not show synchronized firing during the same task-related events. The results provide required evidence in support of previously suggested task-related sensorimotor processing in the FCx via functionally segregated minicolumns.


Figures

Figure 1
Figure 1
FCx recording sites with conformal ceramic MEA. (A) Illustration of NHP brain (upper) showing frontal and prefrontal cortical recording locations (Areas 46, 8, 6), cross-section of arcuate sulcus (middle) showing location of Layer 2/3 and Layer 5 with electrode track and close up of W3-ceramic MEA (lower) with dimensions of four separated (1350 µm) recording sites (Area: 20 × 150 µm/site, 40 µm separation between sites) designated for each layer (2a–d, 5a–d). dlPFC = dorsolateral pFC; dPMC = dorsal premotor cortex. (B) Diagram showing arrangement of ceramic MEA recording sites relative to orientation of pyramidal cell bodies and dendrites in Layer 2/3 and Layer 5 in arcuate sulcus. Filled rectangles depict grouping of recording sites (2a–d, 5a–d) on ceramic MEA shown in panel B within each layer. (C) Illustration of FCx multineuron activity recorded simultaneously in each layer during a single go/no-go trial. Tick marks depict occurrence of extracellular recorded action potentials (spikes) over time (sec) at each of the indicated electrode recording sites.
Figure 2
Figure 2
Task-related FCx neuron activity recorded with ceramic MEA. (A) Diagram of go/no-go task shows images to which animals responded in different task phases on each type of trial. go Resp = selection of go target; Timeout = 5.0 sec delay interval on no-go trial. Below: Mean performance for go target and no-go stimulus trials for all animals (n = 3), indicating that nearly perfect performance during stage of testing in which neuronal activity was acquired. (B) Display shows activity recorded during a single go/no-go session from 14 individual FCx neurons (superimposed waveforms, calibration = 1 msec, 150 µV) distributed in Layer 2/3 and Layer 5 from an animal during go/no-go task performance. Neurons were detected and electronically isolated at the individual recording sites on the ceramic MEA probe diagram with more than one neuron (indicated by differences in waveform) isolated from some recording sites. PEHs next to waveforms show average firing rate (Hz) of the same neurons during go target presentations (red line 0.0 sec) within the go/no-go session. Asterisks in PEHs indicate significant increases in peak firing over baseline rates before go target presentation. (C) Strip chart of real-time simultaneous records from recording sites 2a–c separated by 40 µm on ceramic MEA probe shows that the same signals, including extracellular action potentials (arrows), were not routinely detected on both sites despite proximity. Continuous waveforms were amplified 10,000×, band-pass filtered from 250 to 8000 Hz, and digitized at 40 kHz. Scale bar: 50 msec, 50 mV (before amplification).
Figure 3
Figure 3
Task-related FCx neuron firing: start ring presentation. (A) Single trial raster displays and PEHs illustrate firing patterns (black dots) of two RS FCx pyramidal cells (waveform calibration = 1.0 msec, 150 µV) recorded from Layer 2/3 (upper) or Layer 5 (lower) at the indicated MEA probe recording sites (2a and 5a) for 1.0 sec before and 3.0 sec after start ring presentation (0.0 sec red line). Trial completion via either reward delivery or occurrence of error response indicated by red dots in the raster displays. (B) Mean ± SEM firing rates for all RS FCx cells recorded in Layer 2/3 (upper) at MEA sites 2a–d (n = 54) or Layer 5 (below) at MEA sites 5a–d (n = 40) for ±3.0 sec during start ring presentation (0.0 sec, red line) summed over all trials (mean rates = 100-msec bins).
Figure 4
Figure 4
Task-related FCx neuron firing: go target presentation. (A) Single session PEHs and raster displays for two RS FCx cells recorded in Layer 2/3 (upper: MEA probe site 2a) or Layer 5 (lower: MEA site 5b) in response to go target presentation (red line, 0 sec). Red dots in raster displays indicate occurrence of go response on each trial. Insets: superimposed waveforms from each neuron (calibration = 1.0 msec, 150 µV). (B) CCH of cell pairs at different sites showing mean (SEM) probability of firing (ratio of extracellular spike occurrences) of Layer 5 RS FCx cells recorded at MEA site 5b (lower raster and PEH in panel A) within ±10.0 msec of individual spike occurrences from the Layer 2/3 RS FCx cell (0 msec in CCH) recorded at site 2a (upper raster and PEH). Firing synchrony calculated over ±2.0 sec PEH time relative to go target presentation for trials shown in panel A.
Figure 5
Figure 5
Dual vertical FCx neuron firing: go target presentation. (A) Mean ± SEM firing rates summed over all RS FCx cells recorded in Layer 2/3 and Layer 5 during ±3.0 sec of go target presentation (0.0 sec red line) similar to Figure 3B. Firing is shown for cells recorded simultaneously at the 2ab and 5ab recording sites in the same (straight line) vertical orientation on the MEA probe. Asterisk (*) indicates significant difference between peak firing rate in Layer 2/3 sites versus lower peak rates at Layer 5 sites; Layer 2/3 peak, 10.83 ± 1.25 Hz versus Layer 5 peak, 7.09 ± 0.89, F(1, 2486) = 4.61, p < .01. (B) Mean ± SEM firing rates for simultaneously recorded cells in Layer 2/3 and Layer 5 recorded at the adjacent vertical oriented recording sites, 2cd and 5cd, on the MEA probe. Asterisk (*) indicates significant difference between peak mean firing rate Layer 2/3 cells versus lower peak rate for Layer 5 cells; Layer 2/3 peak, 9.01 ± 1.31 Hz versus Layer 5 peak, 6.25 ± 1.31, F(1, 2486) = 4.44, p < .01. (C) CCHs show probability of firing as mean ± SEM proportion of coincident Layer 5 and Layer 2/3 spikes per 1.0 msec for pairs of cells shown in panels A (blue bars) and B (red bars) recorded at each of the two parallel vertical orientations (2ab–5ab, n = 14 cell pairs or 2cd–5cd, n = 18 cell pairs) on the MEA probe. †F(4, 1783) = 3.46, p < .01; ‡F(4, 1783) > 5.29, p < .001, indicating significant increase in mean firing probability over baseline. (D) CCHs compare mean ± SEM firing probabilities for pairs of cells recorded from MEA sites the same (n = 24 pairs) vertical orientation (2ab–5ab or 2cd–5cd, blue bars, blue squares in probe diagram) or MEA sites (n = 32 pairs) with opposite (i.e., diagonal) vertical site orientations (2ab–5cd or 2cd–5ab, red bars, red squares in probe diagram). Asterisks (*p < .01, **p < .001) indicate significant differences in mean probability of firing for same (i.e., 2ab–5ab, blue squares) versus different (i.e., 2ab–5cd, red squares) vertically oriented cell pairs, *F(1, 3356) > 6.7, p < .01; **F(1, 3356) > 10.8, p < .001. Synchronized firing between cell pairs recorded at opposite vertical orientations (red bars) did not differ, F(1, 1783) = 1.61, ns, at any of the calculated interspike intervals (±10.0 msec). Firing of neurons recorded from the same layer but opposite vertical orientation (2a–c, green squares denote recording sites) were also not correlated, F(1, 1783) = 1.61, ns (see also Figure 2C).
Figure 6
Figure 6
Task-related FCx neuron firing: go response. (A) Single trial raster displays and PEHs for RS FCx cells recorded in Layer 2/3 (upper) and Layer 5 (lower) during the behavioral go response (red line, 0.0 sec) to go target presentation (red dots), which consisted of movement of the cursor into the go target image to a receive juice reward. Insets: waveforms (calibration = 1.0 msec, 150 µV). (B) Firing rates (mean ± SEM) of all FCx cells recorded in Layer 2/3 and Layer 5 summed over 2.0 sec before and 3.0 sec after completion of go target response. Asterisks indicate significant difference of mean peak increase in Layer 2/3 rate versus peak changes in Layer 5, **F(4, 2749) = 5.02, p < .001. (C) CCHs comparing synchronized firing of pairs of cells in panel B recorded at either the same (2ab–5ab, 2cd–5cd; blue bars) or the opposite (diagonal: 2ab–5cd, 2cd–5ab; red bars) vertical MEA sites during go target response. Asterisks indicate significant differences in mean probability of firing, *F(1, 2117) > 7.3, p < .01; **F(1, 2117) > 11.1, p < .001.
Figure 7
Figure 7
Task-related FCx neuron firing: no-go stimulus presentation. (A) Firing patterns of two RS FCx pyramidal cells in Layer 2/3 (upper) and Layer 5 (lower) during no-go stimulus presentation. Single trial raster displays and PEHs (± 2.0 sec) show cell firing before and after no-go stimulus presentation (red line = 0.0 sec). Insets waveforms (calibration = 1.0 msec, 150 µV). (B) Mean ± SEM firing rates (±3.0 sec) for all cells recorded in Layer 2/3 (upper) and Layer 5 (lower) during no-go stimulus presentation (see Figures 3 and 5, go target presentation). Peak mean firing in Layer 2/3 cells was significantly higher than that in Layer 5 cells, *F(1, 2883) = 7.53, p < .01. No additional significant changes from baseline in mean firing rates were detected in either Layer 2/3 or Layer 5 cells during the remaining 3.5 sec of the no-go timeout interval. (C) CCHs for pairs of cells recorded in panel B during no-go stimulus presentation at MEA sites with the same (2ab–5ab, 2cd–5cd) or opposite (2ab–5cd, 2cd–5ab) vertical orientations. Asterisks indicate comparison of same versus opposite vertical orientation sites, *F(1, 2306) > 6.8, p < .01; **F(1, 2306) > 10.9, p < .001.
Figure 8
Figure 8
FS Neurons in FCx: start ring presentation. (A) Single trial raster displays and PEHs show firing patterns of two FS FCx neurons recorded from Layer 2/3 (upper) and Layer 5 (lower), respectively, during start ring presentation (see Figure 3). Insets: waveforms for each FS cell (calibration = 1.0 msec, 150 µV). (B) Mean ± SEM firing rates summed over all FS cells recorded in Layer 2/3 (upper) and Layer 5 (lower) during presentation of start ring image (black line at 0.0 sec). Layer 5 FS cells showed a greater mean peak increase at 0.5 sec after the start ring presentation (21.47 ± 2.83 Hz) relative to prepresentation baseline (−2.0 sec) rate (14.62 ± 0.29 Hz) than Layer 2/3 FS cells (12.47 ± 2.11 Hz) relative to their respective baseline (8.13 ± 0.37 Hz) firing rate, **F(1, 3388) = 10.13, p < .001. (C) CCHs for pairs of fast-spiking cells recorded in panel B during start ring presentation at sites on the recording MEA with the same (2ab–5ab, 2cd–5cd) or opposite (2ab–5cd, 2cd–5ab) vertical orientations. Asterisks indicate minimal mean values for significance levels of *F(1, 1916) > 7.1, p < .01, **F(1, 1916) > 11.3, p < .001.
Figure 9
Figure 9
Task-related signal processing in frontal cortical cell layers. MEA probe: Diagram of conformal MEA at left shows recording arrangement that allowed determination of correspondence between task-related firing in Layer 2/3 cells (blue triangles) and Layer 5 cells (red triangles) in NHPs during performance of go/no-go task. Go trial: Composite mean firing profile of cells over the time course of a go target trial in which Layer 2/3 cells (blue trace) and Layer 5 cells (red trace) were sequentially activated by task-relevant stimuli (start ring, go target presentation, and response). No-go trial: Diagram depicts the same events for a no-go trial showing composite mean firing of Layer 2/3 (blue trace) and Layer 5 (red trace) cells was similar to go Trials but with no differential firing between layers during the no-go timeout interval. The demonstrated synergy of the excitatory peaks between cells in Layer 2/3 and Layer 5 during task-related events (downward red arrows) is consistent with proposed top–down flow of sensorimotor information (Weiler et al., 2008; Yoshimura et al., 2005; Lebedev et al., 2002), indicative of “columnar readout” of the two distinct motor plans required on go and no-go trials.
Figure 10
Figure 10
Specificity of columnar processing of task-related information in FCx layers. Composite CCHs for all FCx cells recorded in each task-related event partitioned with respect to Layer 2/3 and Layer 5 cell pairs recorded from either the same or the opposite vertically oriented recording sites on the conformal MEA illustrated in diagram at right. Columnar (upper) CCHs show synergistic firing (increased mean firing probabilities) between pairs of cells recorded at sites with the same (2ab–5ab, 2cd–5cd) vertical orientation on the MEA. Task events are listed for each color of bar. Noncolumnar CCHs (lower) show that under no task-related conditions (events) did Layer 5 cells recorded at opposite (i.e., diagonal) vertical orientations on the MEA (2ab–5cd or 2cd–5ab) fire in a synergistic manner with Layer 2/3 cells. The CCHs provide strong evidence for “minicolumnar” processing of task-relevant information (Weiler et al., 2008). Symbols (##) indicate comparison of columnar (blue dotted arrow) versus noncolumnar (red dotted arrow) synchrony at ±1.0 msec, F(1, 2117) > 11.1, p < .001. Symbol (‡) indicates minimal increase in synchrony (mean ± SEM firing probability) above background level (±6.0 msec) required to achieve significance, F(4, 1783) > 5.03, p < .001. CCH data for go target presentation, go target response, and no-go stimulus as shown in Figures 3–8, with time scale shortened to ±5.0 msec.

References

    1. Andersen RA, Buneo CA. Sensorimotor integration in posterior parietal cortex. Advances in Neurology. 2003;93:159–177. - PubMed
    1. Barbas H, Pandya DN. Architecture and frontal cortical connections of the premotor cortex (area 6) in the rhesus monkey. Journal of Comparative Neurology. 1987;256:211–228. - PubMed
    1. Barbas H, Pandya DN. Architecture and intrinsic connections of the prefrontal cortex in the rhesus monkey. Journal of Comparative Neurology. 1989;286:353–375. - PubMed
    1. Boussaoud D, Wise SP. Primate frontal cortex: Effects of stimulus and movement. Experimental Brain Research. 1993;95:28–40. - PubMed
    1. Burmeister JJ, Moxon K, Gerhardt GA. Ceramic-based multisite microelectrodes for electrochemical recordings. Analytical Chemistry. 2000;72:187–192. - PubMed

Publication types