

Prevention, but not cure, of autoimmune diabetes in a NOD.scid transfer model by FTY720 despite effective modulation of blood T cells
- PMID: 20695767
- PMCID: PMC2994995
- DOI: 10.3109/08916934.2010.499885
Prevention, but not cure, of autoimmune diabetes in a NOD.scid transfer model by FTY720 despite effective modulation of blood T cells
Abstract
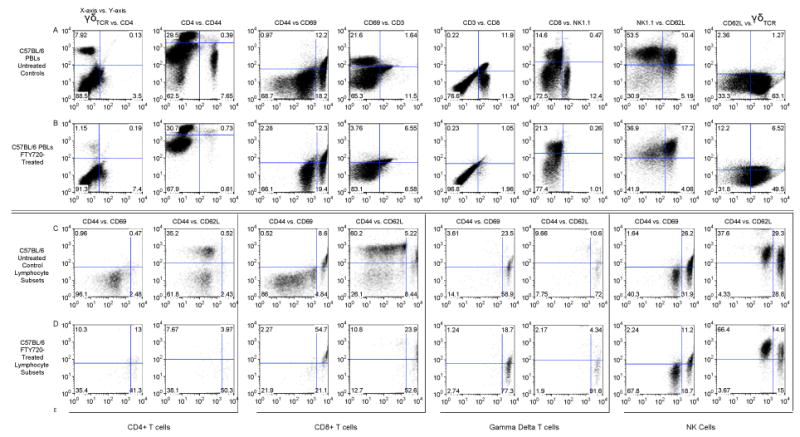
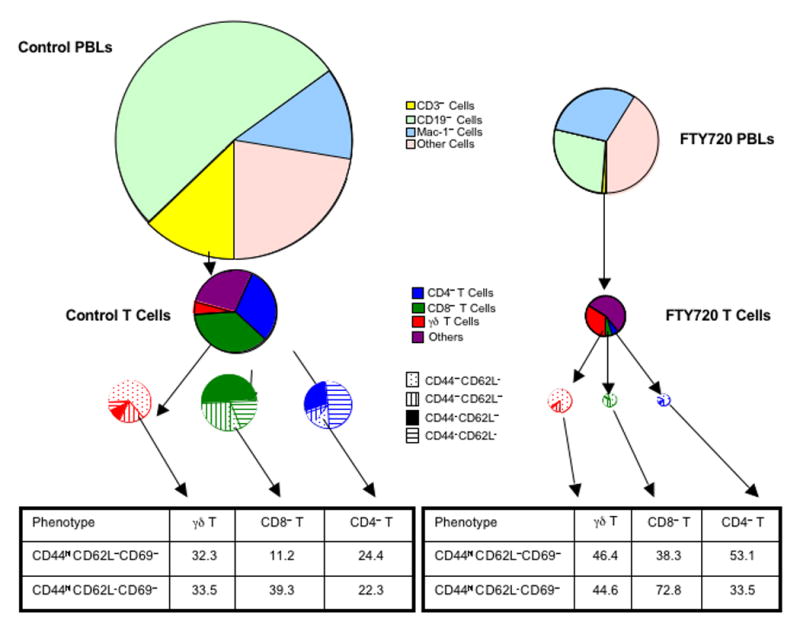
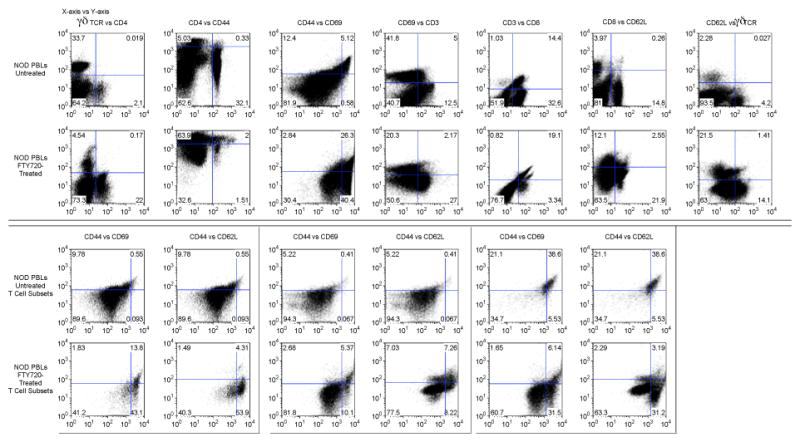
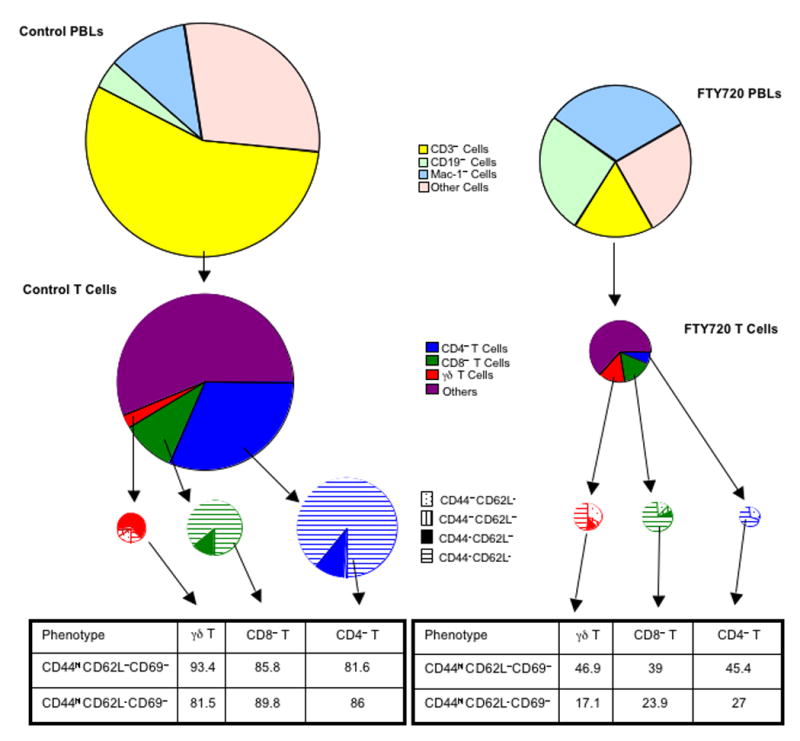
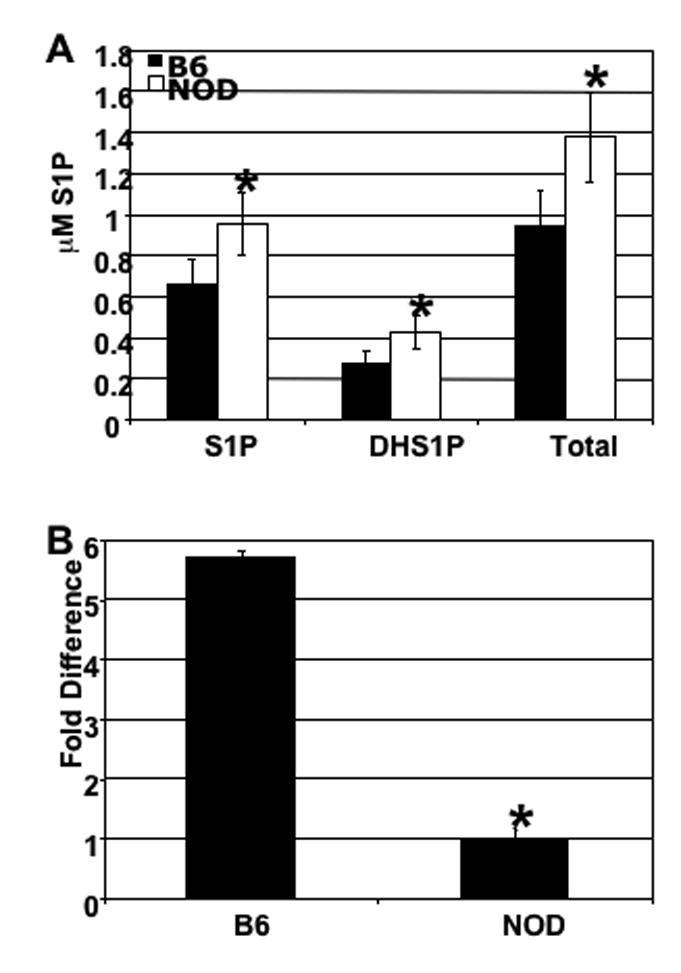
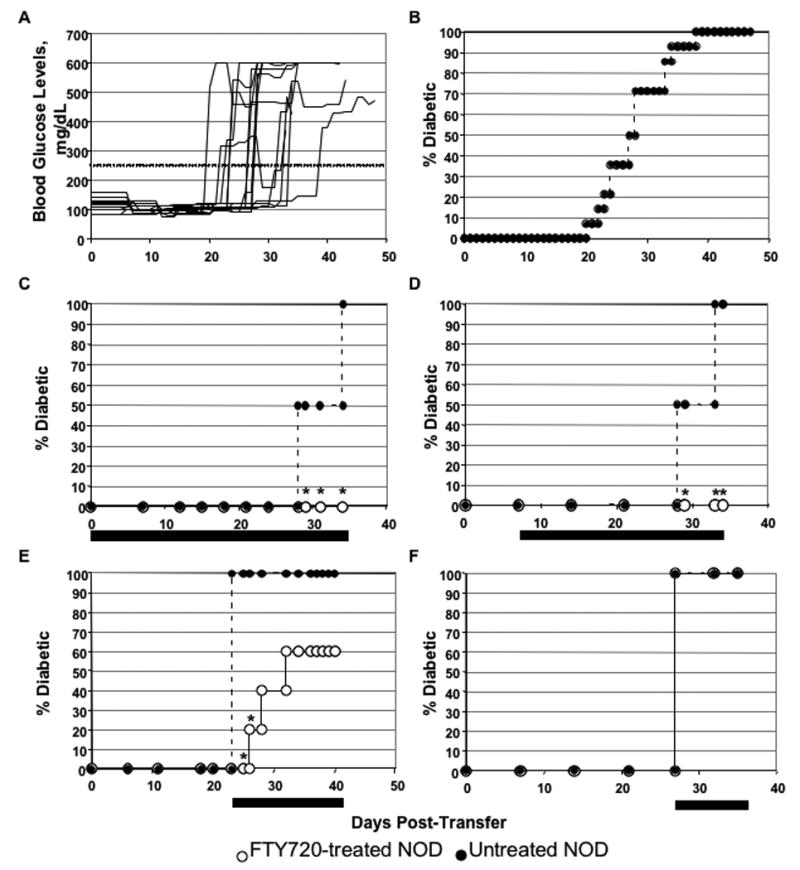
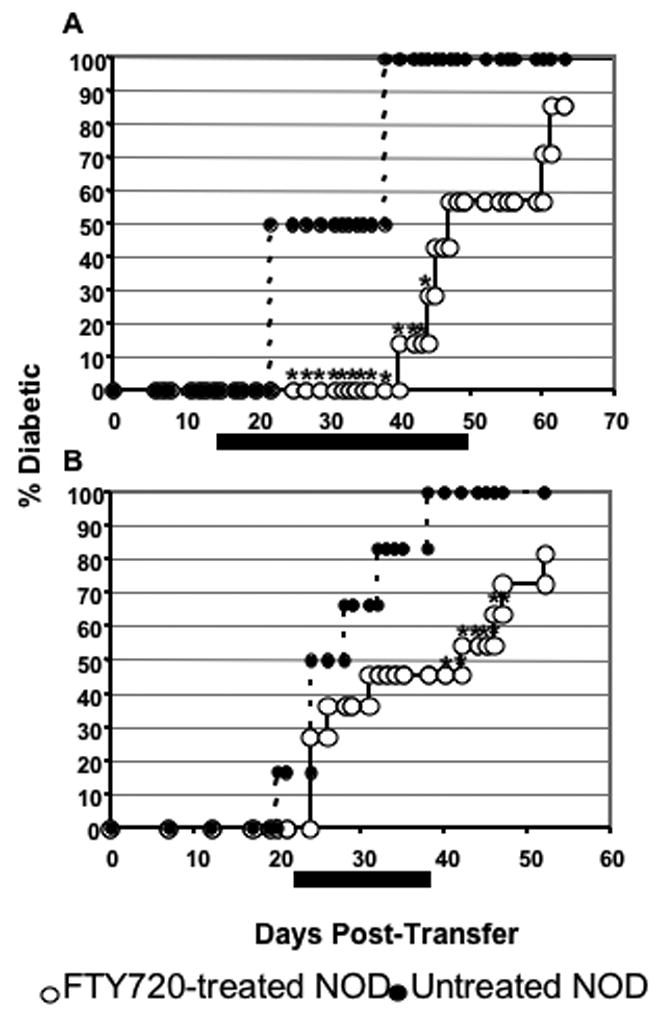
FTY720 modulates lymphocyte trafficking through blood (peripheral blood lymphocyte, PBL) and peripheral lymph nodes (PLN). Treatment with FTY720 causes retention of most blood lymphocytes in PLN. Long-term treatment can slow and/or prevent Type 1 diabetes (T1D) in the nonobese diabetic (NOD) mouse model. B and T cells are both affected by FTY720 binding to sphingosine-1-phosphate receptor 1 (S1P₁). However, little has been done to elucidate which T-cell subsets are differentially affected by FTY720 under healthy conditions, and how this affects disease pathogenesis in T1D. In healthy C57BL/6J (B6) mice, total CD4(+) and CD8(+) T-cell subsets were diminished by FTY720, but recently activated and memory subsets were spared and constituted significantly higher percentage of remaining T cells in blood. FTY720 also lowered PBL counts in NOD mice, but less severely than in B6 mice. This is consistent with a different ratio of naïve, activated, and memory cells in NOD mice compared to those in B6 mice, as well as alterations in S1P₁ and sphingosine-1-phosphate (S1P) levels in PBLs and blood of NOD mice, respectively. To address the functional consequences of PBL T-cell depletion, we studied the effects of FTY720 on disease progression in a timed adoptive transfer model of T1D. Continuous treatment with FTY720 eliminated T1D, if treatment was started before splenocyte transfer. FTY20 treatment started after disease onset slowed disease progression. The inability to fully suppress memory and effector T-cell circulation may explain why FTY720 is only partially effective in the NOD adoptive transfer model of T1D.
Figures
Similar articles
-
Prevention of diabetes by FTY720-mediated stabilization of peri-islet tertiary lymphoid organs.Diabetes. 2010 Jun;59(6):1461-8. doi: 10.2337/db09-1129. Epub 2010 Mar 18. Diabetes. 2010. PMID: 20299465 Free PMC article.
-
Prevention and cure of autoimmune diabetes in nonobese diabetic mice by continuous administration of FTY720.Transplantation. 2005 May 15;79(9):1051-5. doi: 10.1097/01.tp.0000161220.87548.ee. Transplantation. 2005. PMID: 15880042
-
FTY720-induced conversion of conventional Foxp3- CD4+ T cells to Foxp3+ regulatory T cells in NOD mice.Am J Reprod Immunol. 2011 Nov;66(5):349-62. doi: 10.1111/j.1600-0897.2011.01010.x. Epub 2011 May 27. Am J Reprod Immunol. 2011. PMID: 21623989
-
FTY720 (fingolimod) in Multiple Sclerosis: therapeutic effects in the immune and the central nervous system.Br J Pharmacol. 2009 Nov;158(5):1173-82. doi: 10.1111/j.1476-5381.2009.00451.x. Epub 2009 Oct 8. Br J Pharmacol. 2009. PMID: 19814729 Free PMC article. Review.
-
Ascomycete derivative to MS therapeutic: S1P receptor modulator FTY720.Prog Drug Res. 2008;66:361, 363-81. doi: 10.1007/978-3-7643-8595-8_8. Prog Drug Res. 2008. PMID: 18416311 Review.
Cited by
-
Apolipoprotein M-A Marker or an Active Player in Type II Diabetes?Front Endocrinol (Lausanne). 2021 May 21;12:665393. doi: 10.3389/fendo.2021.665393. eCollection 2021. Front Endocrinol (Lausanne). 2021. PMID: 34093440 Free PMC article. Review.
-
Autoimmunity in 2011.Clin Rev Allergy Immunol. 2012 Aug;43(1-2):194-206. doi: 10.1007/s12016-012-8330-2. Clin Rev Allergy Immunol. 2012. PMID: 22733376 Review.
-
Treatment of autoimmune diabetes in NOD mice by Toll-like receptor 2 tolerance in conjunction with dipeptidyl peptidase 4 inhibition.Diabetologia. 2012 Dec;55(12):3308-17. doi: 10.1007/s00125-012-2723-x. Epub 2012 Sep 27. Diabetologia. 2012. PMID: 23011352
-
Inhibition of Cathepsin S Reduces Lacrimal Gland Inflammation and Increases Tear Flow in a Mouse Model of Sjögren's Syndrome.Sci Rep. 2019 Jul 2;9(1):9559. doi: 10.1038/s41598-019-45966-7. Sci Rep. 2019. PMID: 31267034 Free PMC article.
-
Rapamycin Eye Drops Suppress Lacrimal Gland Inflammation In a Murine Model of Sjögren's Syndrome.Invest Ophthalmol Vis Sci. 2017 Jan 1;58(1):372-385. doi: 10.1167/iovs.16-19159. Invest Ophthalmol Vis Sci. 2017. PMID: 28122086 Free PMC article.
References
-
- Brown BA, Kantesaria PP, McDevitt LM. Fingolimod: A novel immunosuppressant for multiple sclerosis. Ann Pharm. 2007;41:1660–8. - PubMed
-
- Maki T, Gottschalk R, Monaco AP. Prevention of autoimmune diabetes by FTY720 in nonobese diabetic mice. Transplantation. 2002;74:1684–6. - PubMed
-
- Maki T, Gottschalk R, Ogawa N, Monaco AP. Prevention and cure of autoimmune diabetes in nonobese diabetic mice by continuous administration of FTY720. Transplantation. 2005;79:1051–5. - PubMed
-
- Yang Z, Chen M, Gialkow LB, Ellett JD, Wu R, Brinkmann V, et al. The immune modulator FTY720 prevents autoimmune diabetes in nonobese diabetic mice. Clin Immunol. 2003;107:30–5. - PubMed
-
- Alperovich G, Rama I, Lloberas N, Franquesa M, Poveda R, Goma M, et al. New immunosuppressor strategies in the treatment of murine lupus nephritis. Lupus. 2007;16:18–24. - PubMed
Publication types
MeSH terms
Substances
Grants and funding
LinkOut - more resources
Full Text Sources
Other Literature Sources
Medical
Research Materials