. 2010 Aug 10:10:414.
doi: 10.1186/1471-2407-10-414.

Nuclear beta-catenin and CD44 upregulation characterize invasive cell populations in non-aggressive MCF-7 breast cancer cells

Affiliations

Nuclear beta-catenin and CD44 upregulation characterize invasive cell populations in non-aggressive MCF-7 breast cancer cells

Masahiro Uchino et al. BMC Cancer. .

Abstract

Background: In breast cancer cells, the metastatic cell state is strongly correlated to epithelial-to-mesenchymal transition (EMT) and the CD44+/CD24- stem cell phenotype. However, the MCF-7 cell line, which has a luminal epithelial-like phenotype and lacks a CD44+/CD24- subpopulation, has rare cell populations with higher Matrigel invasive ability. Thus, what are the potentially important differences between invasive and non-invasive breast cancer cells, and are the differences related to EMT or CD44/CD24 expression?

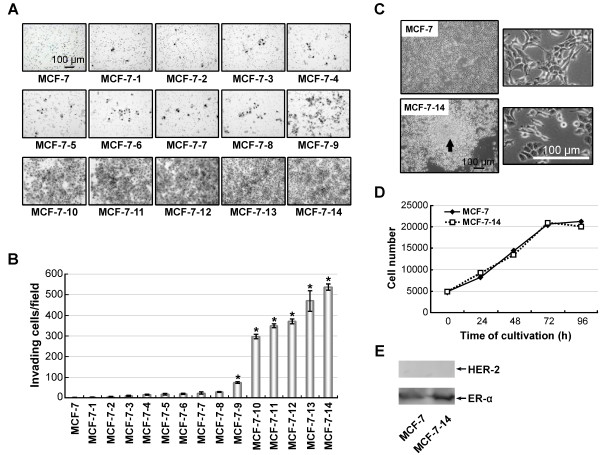
Methods: Throughout the sequential selection process using Matrigel, we obtained MCF-7-14 cells of opposite migratory and invasive capabilities from MCF-7 cells. Comparative analysis of epithelial and mesenchymal marker expression was performed between parental MCF-7, selected MCF-7-14, and aggressive mesenchymal MDA-MB-231 cells. Furthermore, using microarray expression profiles of these cells, we selected differentially expressed genes for their invasive potential, and performed pathway and network analysis to identify a set of interesting genes, which were evaluated by RT-PCR, flow cytometry or function-blocking antibody treatment.

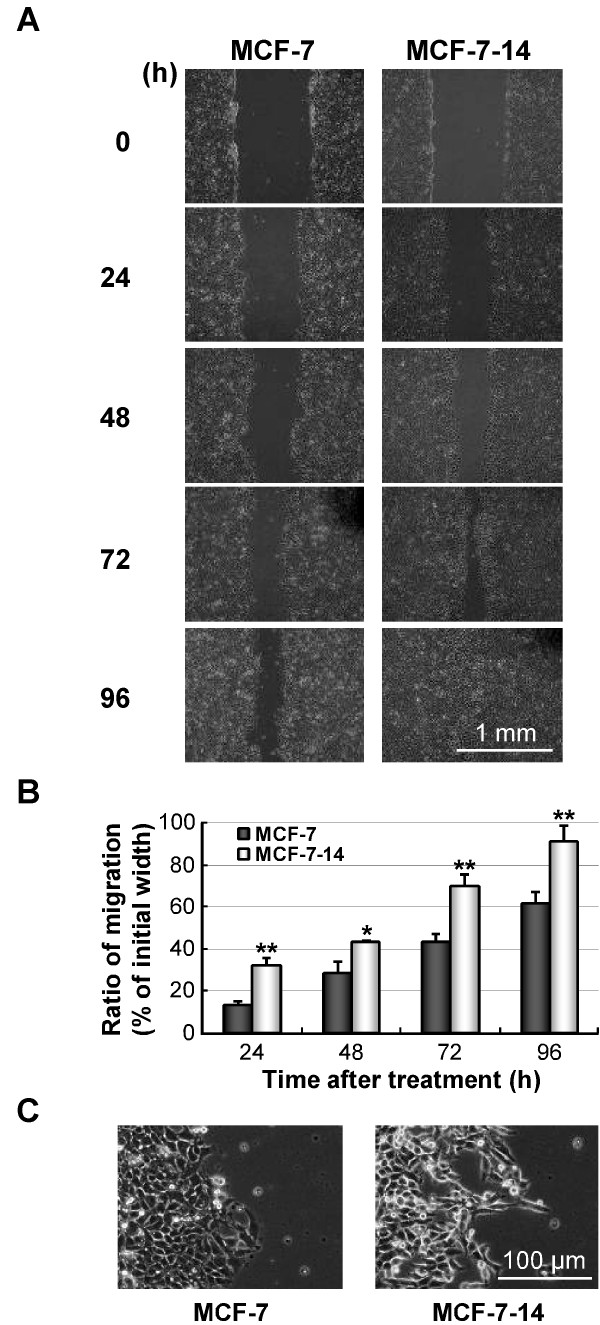
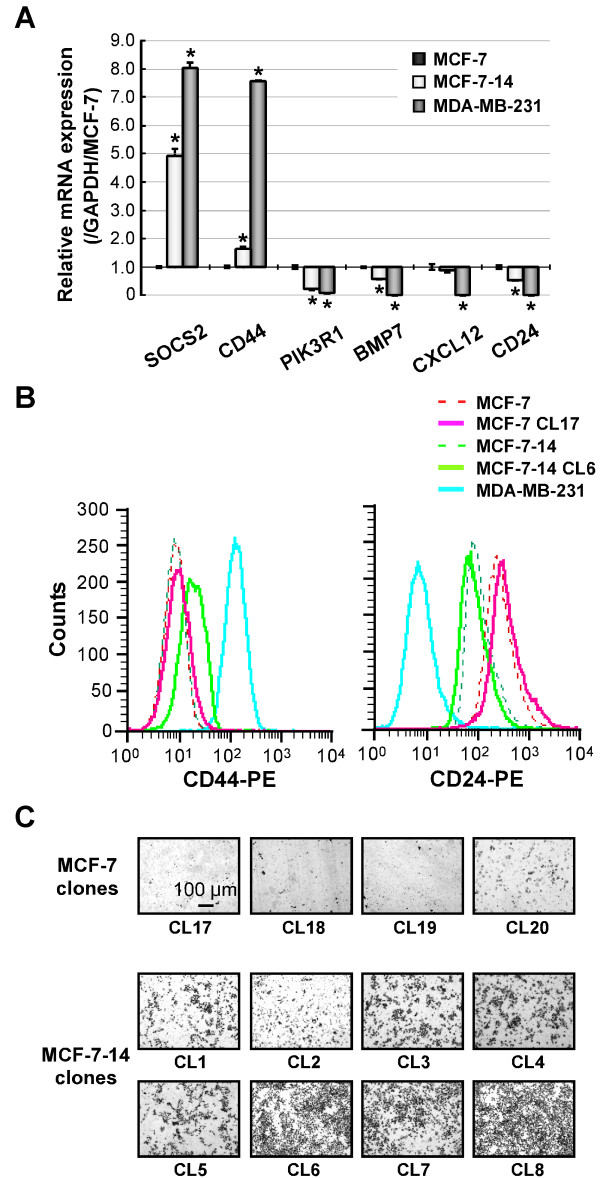
Results: MCF-7-14 cells had enhanced migratory and invasive ability compared with MCF-7 cells. Although MCF-7-14 cells, similar to MCF-7 cells, expressed E-cadherin but neither vimentin nor fibronectin, beta-catenin was expressed not only on the cell membrane but also in the nucleus. Furthermore, using gene expression profiles of MCF-7, MCF-7-14 and MDA-MB-231 cells, we demonstrated that MCF-7-14 cells have alterations in signaling pathways regulating cell migration and identified a set of genes (PIK3R1, SOCS2, BMP7, CD44 and CD24). Interestingly, MCF-7-14 and its invasive clone CL6 cells displayed increased CD44 expression and downregulated CD24 expression compared with MCF-7 cells. Anti-CD44 antibody treatment significantly decreased cell migration and invasion in both MCF-7-14 and MCF-7-14 CL6 cells as well as MDA-MB-231 cells.

Conclusions: MCF-7-14 cells are a novel model for breast cancer metastasis without requiring constitutive EMT and are categorized as a "metastable phenotype", which can be distinguished from both epithelial and mesenchymal cells. The alterations and characteristics of MCF-7-14 cells, especially nuclear beta-catenin and CD44 upregulation, may characterize invasive cell populations in breast cancer.


Figures

Figure 1
Figure 1
In vitro sequential selection of invasive populations from MCF-7 cells using Matrigel Invasion Chambers. (A and B) In each cycle, cells invading the Matrigel were fixed with 10% formalin-neutralized buffer and stained with crystal violet on the underside of the chamber (A), and then the numbers of invading cells were counted under a microscope (B). Data are the means ± SD (n = 3). Statistical analysis was performed by Student's t test. *, P < 0.01, compared with MCF-7 cells. (C) Images of morphology of MCF-7 and MCF-7-14 cells in culture. MCF-7-14 cells were propagated as non-adherent spheres (arrow). (D) Proliferative rates of MCF-7 and MCF-7-14 cells. (E) Western blotting analysis for the expression of HER-2 and ER-α in MCF-7 and MCF-7-14 cells.
Figure 2
Figure 2
Migratory abilities of MCF-7 and MCF-7-14 cells in wound healing assay. (A) Optical microscopic images of in vitro wound healing at 0, 24, 48, 72 and 96 h after the creation of wounds. (B) Comparison of images to quantify the migration rate of the cells. Wound distances were measured at each time point and expressed as percent wound closure by comparing the zero time. Data are the means ± SD (n = 3). Statistical analysis was performed by Student's t test. *, P < 0.05; P < 0.01, compared with MCF-7. (C) Optical microscopic images of MCF-7 and MCF-7-14 cells at the invading edges of the wound at 48 h after the creation of wounds.
Figure 3
Figure 3
Metastatic abilities of MCF-7 and MCF-7-14 cells in mouse xenograft model. (A) In vivo scanning of EGFP-expressing breast cancer cells in mice at 4 weeks after implantation into the mammary fat pad. In an MCF-7-14-EGFP-bearing mouse, metastasis to the pancreas (arrowhead) was imaged, corresponding to the photo of the abdomen. (B) EGFP-positive region in panel A was analyzed by HE and MGP staining, or unstained sections were analyzed for EGFP fluorescence. Metastasized MCF-7-14-EGFP cells (M) invaded pancreatic parenchyma (P). (C) Representative pancreas metastasis 12 weeks after implantation of MCF7-14-EGFP cells. Pancreas metastasis showed strong stromal (S) and angiogenic responses (brown) closely intermingled with metastasized tumor cells (M).
Figure 4
Figure 4
Comparative analysis of epithelial and mesenchymal marker expression. (A) Immunostaining for CK19, E-cadherin and vimentin (brown or green) was performed on mammary xenografts and pancreas metastases 4 or 12 weeks after implantation of MCF-7-EGFP and MCF-7-14-EGFP cells. (B) qRT-PCR analysis of mRNA expression of E-cadherin, N-cadherin, and vimentin performed on RNA samples isolated from MCF-7, MCF-7-14 and MDA-MB-231 cells. Results were normalized to internal control GAPDH mRNA. Data are the means ± SD (n = 3). Statistical analysis was performed by ANOVA and Tukey-Kramer multiple comparison. *, P < 0.01, compared with MCF-7 cells. (C) Immunofluorescence analysis of MCF-7, MCF-7-14 and MDA-MB-231 cells using anti-E-cadherin, anti-β-catenin, anti-vimentin and anti-fibronectin mAbs (green). Cells were nuclear counterstained with DAPI (blue).
Figure 5
Figure 5
Microarray gene expression data mining: hierarchical clustering and functional network analysis. (A) Hierarchical clustering analysis of gene expression profiles in MCF-7, MCF-7-14 and MDA-MB-231 cell lines. Columns represent the 13,092 probe sets detected in all samples. Measurements of each probe were normalized to the median of the probe measurements in MCF-7, MCF-7-14 and MDA-MB-231 cell lines. The intensity of bar colors indicates the degree of gene upregulation (red) or downregulation (green). Although the MCF-7-14 cell gene expression profile was more similar to that of MCF-7 cells than to MDA-MB-231 cells, there were some similarities between MCF-7-14 and MDA-MB-231 cells in gene expression (black flames). (B) To identify potentially important differences in biological mechanisms regarding their invasive potential, we selected 163 probe sets up- (red, see Additional file 2) or downregulated (green, see Additional file 3) >2-fold in both MCF-7-14 and MDA-MB-231 cells compared with MCF-7 cells. Results are represented relative to mRNA levels of MCF-7 cells. (C) The most significant network of 163 probe sets (144 unique genes) constructed using IPA 5.0 (see Additional file 4). Gene network is represented as nodes and lines between two nodes. Node shapes symbolize the functional class of the gene product: square, cytokine; diamond, enzyme; inverted triangle, kinase; rectangle, nuclear receptor; ellipse, transcription regulator; circle, other. The intensity of node colors indicates the degree of upregulation (red) or downregulation (green). Continuous and dashed lines indicate direct and indirect interactions between molecules, respectively. Bold nodes represent multiple-mapped genes (see also Table 1) or selected interesting genes.
Figure 6
Figure 6
mRNA and protein expression of selected interesting genes. (A) qRT-PCR analysis of mRNA expression of SOCS2, CD44, PIK3R1, BMP7, CXCL12 and CD24 was performed on RNA from MCF-7, MCF-7-14 and MDA-MB-231 cells. Results were normalized to internal control GAPDH mRNA and represented relative to mRNA levels of MCF-7 cells. Data are the means ± SD (n = 3). Statistical analysis was performed by ANOVA and Tukey-Kramer multiple comparison.*, P < 0.01, compared with MCF-7 cells. (B) CD44 and CD24 proteins expressed on three human breast cancer cell lines (MCF-7, MCF-7-14 and MDA-MB-231) and single-cell clones derived from MCF-7 and MCF-7-14 cell lines (highly invasive MCF-7-14 CL6 and non-invasive MCF-7 CL17, panel C) were analyzed by flow cytometry. (C) Matrigel invasion assay of single-cell clones derived from MCF-7 (CL17-20) and MCF-7-14 (CL1-8) cell lines. Cells invading Matrigel were stained with crystal violet on the underside of the chamber.
Figure 7
Figure 7
Effects of anti-CD44 antibody treatment on cell proliferation, migration and invasion. (A) Proliferation rates of untreated cells in culture. Data are the means ± SD (n = 3). Statistical analysis was performed by ANOVA and Tukey-Kramer multiple comparison. *, P < 0.01, compared with MCF-7 cells. (B) Proliferation rates of normal rat IgG-treated and anti-CD44 antibody-treated cells. In each cell line, the number of normal IgG-treated cells at 96 h was considered 100%. Data are the means ± SD (n = 3). (C) Optical microscopic images of cell migration assay at 72 h after removal of the stopper. Cells were fixed and stained with crystal violet. (D) Cell migration rates were expressed as percent closure of the open area by comparing the zero time. Data are the means ± SD (n = 6). Statistical analysis was performed by Student's t test or ANOVA/Tukey-Kramer multiple comparison, where appropriate. *, P < 0.01, compared with normal IgG-treated cells., P < 0.01, compared with MCF-7.#, P < 0.01, compared with MCF-7-14 and its clone CL6. (E) Matrigel invasion assay of normal rat IgG-treated and anti-CD44 antibody-treated cells. After 60 h cultivation, cells invading Matrigel were fixed and stained on the underside of the chamber. (F) The numbers of invading cells were counted under a microscope. Data are the means ± SD (n = 3). Statistical analysis was performed by Student's t test or ANOVA/Tukey-Kramer multiple comparison, where appropriate. *, P < 0.01, compared with normal IgG-treated cells., P < 0.01, compared with MCF-7.#, P < 0.01, compared with MCF-7-14 and MDA-MB-231.

Similar articles

Cited by

References

    1. Christiansen JJ, Rajasekaran AK. Reassessing epithelial to mesenchymal transition as a prerequisite for carcinoma invasion and metastasis. Cancer Res. 2006;66:8319–8326. doi: 10.1158/0008-5472.CAN-06-0410. - DOI - PubMed
    1. Charafe-Jauffret E, Ginestier C, Monville F, Finetti P, Adélaïde J, Cervera N, Fekairi S, Xerri L, Jacquemier J, Birnbaum D, Bertucci F. Gene expression profiling of breast cell lines identifies potential new basal markers. Oncogene. 2006;25:2273–2284. doi: 10.1038/sj.onc.1209254. - DOI - PubMed
    1. Fillmore CM, Kuperwasser C. Human breast cancer cell lines contain stem-like cells that self-renew, give rise to phenotypically diverse progeny and survive chemotherapy. Breast Cancer Res. 2008;10:R25. doi: 10.1186/bcr1982. - DOI - PMC - PubMed
    1. Fidler IJ, Kripke ML. Metastasis results from preexisting variant cells within a malignant tumour. Science. 1977;197:893–895. doi: 10.1126/science.887927. - DOI - PubMed
    1. Chu YW, Yang PC, Yang SC, Shyu YC, Hendrix MJ, Wu R, Wu CW. Selection of invasive and metastatic subpopulations from a human lung adenocarcinoma cell line. Am J Respir Cell Mol Biol. 1997;17:353–360. - PubMed

Publication types

MeSH terms