Review
. 2011 Apr 13;51(7):738-53.
doi: 10.1016/j.visres.2010.08.002. Epub 2010 Aug 7.

Features and the 'primal sketch'

Affiliations
Review

Features and the 'primal sketch'

Michael J Morgan. Vision Res. .

Abstract

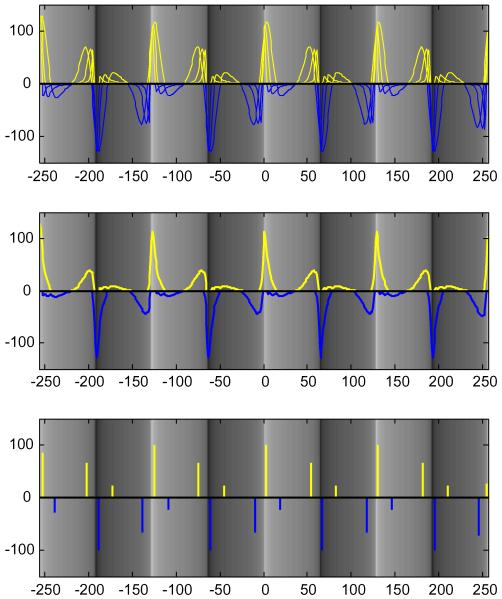
This review is concerned primarily with psychophysical and physiological evidence relevant to the question of the existence of spatial features or spatial primitives in human vision. The review will be almost exclusively confined to features defined in the luminance domain. The emphasis will be on the experimental and computational methods that have been used for revealing features, rather than on a detailed comparison between different models of feature extraction. Color and texture fall largely outside the scope of the review, though the principles may be similar. Stereo matching and motion matching are also largely excluded because they are covered in other contributions to this volume, although both have addressed the question of the spatial primitives involved in matching. Similarities between different psychophysically-based model will be emphasized rather than minor differences. All the models considered in the review are based on the extraction of directional spatial derivatives of the luminance profile, typically the first and second, but in one case the third order, and all have some form of non-linearity, be it rectification or thresholding.


Figures

Fig. 1
Fig. 1
Images (128 × 128 pixels) of two political philosophers (right), one of whom has been discredited. The images on the right contribute their phase spectra of their Fourier transforms to the remaining images in the same row and their amplitude spectra to the other row. The Fourier transform was performed patchwise in overlapping, Gaussian-windowed patches of 62, 32, 16, 8 and 4 pixel width and height (large patches on the left). Note that phase information dominates perceived appearance in large patches, and amplitude in small with hybrids in between. Some viewers may see rivalry in the intermediate cases and other illusory figures such as Tony Blair (from Morgan et al., 1991).
Fig. 2
Fig. 2
The images in the left-hand panels show: (a, top left) the image of a famous face, (b, top right) the image blurred, (c, bottom left) the image with the blurred image subtracted and (d, bottom right) the image with pixel noise added. The images on the right show landscapes of the corresponding images on the right. Pixel intensity is represented by height of the landscape, with color added (red is high and blue is low). From Morgan (2003) with permission.
Fig. 3
Fig. 3
The left-hand figure shows the results of all combinations of principal curvatures {−1, 0, 1} in the x direction (horizontal axis) and {−1, 0, 1} in the vertical direction (vertical axis). The plane with principal curvatures {0, 0} lies in the middle and can be used to inspect afterimages, which are similar to the image at 180° from the adapting image. The right-hand figure shows, from left to right and top to bottom: (a) two intersecting ridges, (b) a plateau with a conspicuous white Mach band, (c) a tent ridge, (d) a Gaussian-blurred edge, (e) a sharp edge and (f) an approximation to a Cwm.
Fig. 4
Fig. 4
Does a patch with negative Gaussian curvature pop out from distracters of zero Gaussian curvature (left) and is the reverse true (right)?
Fig. 5
Fig. 5
The figure, supplied by Roger Watt, illustrates the appearance of a class of 1-D stimuli introduced by Morrone and Burr (1988) in which the amplitude spectrum is that of a (partially blurred) square-wave and all Fourier components have a common phase at the origin. The arrival phase of all components at the origin (x = 0) is π/4 (45°), giving rise to an asymmetrical luminance profile. Most observers see a bright bar at or near the origin. The top panel in addition shows the responses of a bank of four Laplacian-of-Gaussian filters at four spatial scales (Watt & Morgan, 1985) with the half-wave rectified outputs shown as yellow and blue for positive and negative respectively. In the second panel the positive responses are added over all the filters, as (separately) are the negative responses. The final (bottom) panel shows the centroids of zero-bounded regions. In agreement with the local-energy model, a feature is located close to the phase-congruent origin. In agreement with Hesse and Georgeson (2005), the position is shifted slightly to one side. Also in agreement with Hesse and Georgeson (2005) there are features to either side of the bar, asymmetrically placed.
Fig. 6
Fig. 6
‘Spider Webs’ in a drawing by Piranesi of a ceiling from the Villa Adriana. Two black lines are seen going through the centre of the figure, continuing the high contrast curved edges on the outside. The lines are much reduced if the region if the curved edges are masked out, so they are not entirely attributable to low-pass filtering (Morgan & Hotopf, 1989).
Fig. 7
Fig. 7
The experimental results of Georgeson et al. (2007) on the matching of two-component blurred edges are shown by red symbols on the right. The horizontal axis shows the ratio of contrasts between the less-blurred to the more-blurred edge, and the vertical axis shows the blur of the Gaussian-blurred edge that was selected by the observer to be the best match. The left-hand top panel shows the second-derivatives of the edges used in the experiments: red, 15 arcmin; green, 5 arcmin; blue, magenta, average blur. In addition, a blue curve shows the edge with equal amplitude mixtures, but it is hard to see as it is coincident with the smallest blur. The bottom panels show profiles and results when the component blurs were doubled to 30 arcmin (red) and 10 arcmin (green). The red curve on the right shows the predictions of a model in which blur is encoded in the separation between peaks and troughs in the second-derivative. It predicts too high a dominance of the less-blurred edge. The green curve shows the same prediction but in the presence of intrinsic blur.

References

    1. Anstis SM. The perception of apparent movement. Philosophical Transactions of the Royal Society London. Series B, Biological Sciences. 1980;290:153–168. - PubMed
    1. Atkinson J, Campbell FW. The effect of phase on the perception of compound gratings. Vision Research. 1974;14(2):159–162. - PubMed
    1. Barth E, Zetzsche C, Rentschler I. Intrinsic two-dimensional features as textons. Journal of the Optical Society of America. A, Optics, Image Science, and Vision. 1998;15(7):1723–1732. - PubMed
    1. Bergen JR, Adelson EH. Early vision and texture perception. Nature. 1988;333(6171):363–364. - PubMed
    1. Blakemore C, Sutton P. Size adaptation: A new aftereffect. Science. 1969;166:245–247. - PubMed

MeSH terms