. 2010 Aug 30;207(9):1907-21.
doi: 10.1084/jem.20092749. Epub 2010 Aug 9.

Central nervous system (CNS)-resident natural killer cells suppress Th17 responses and CNS autoimmune pathology

Affiliations

Central nervous system (CNS)-resident natural killer cells suppress Th17 responses and CNS autoimmune pathology

Junwei Hao et al. J Exp Med. .

Abstract

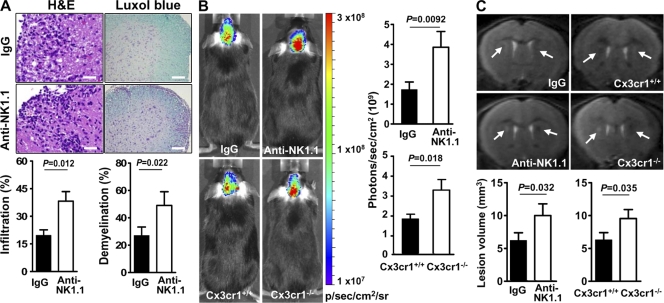
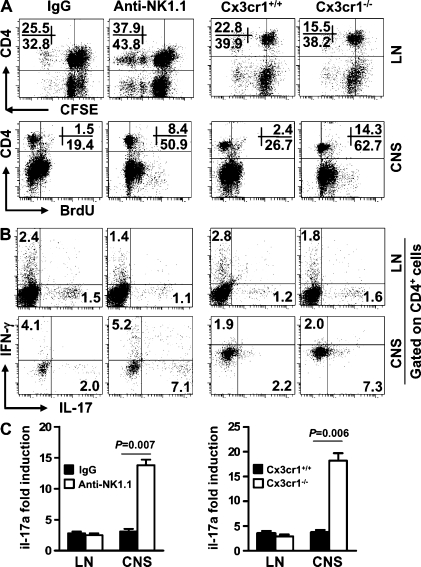
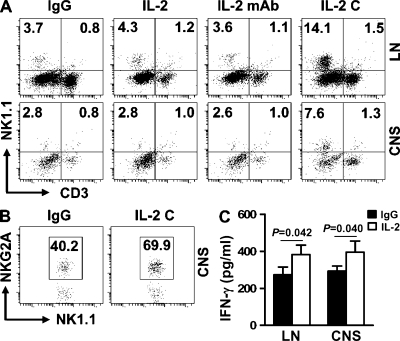
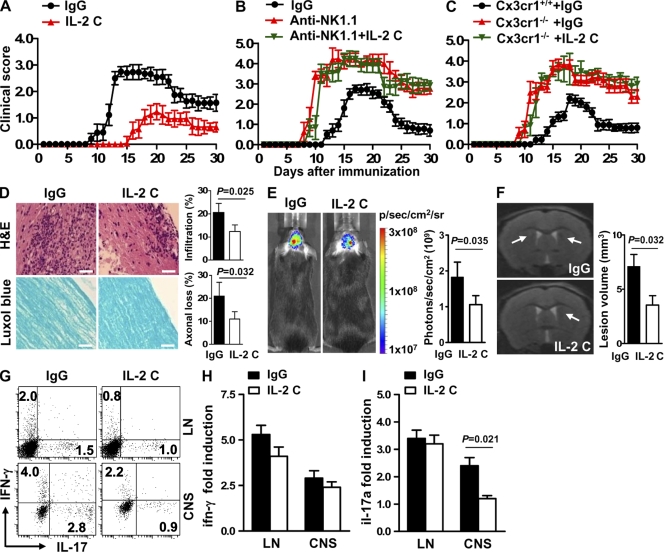
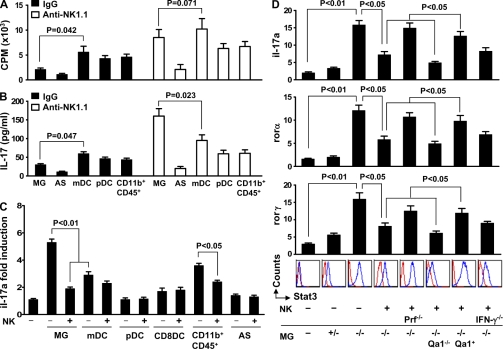
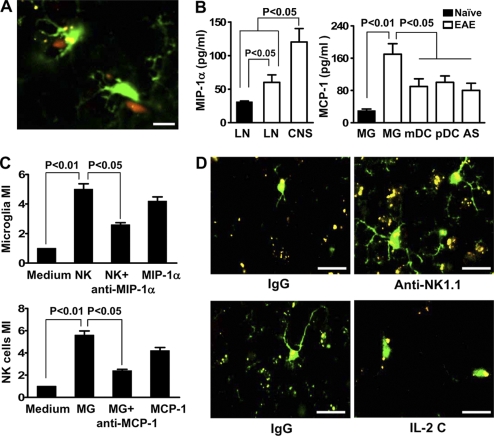
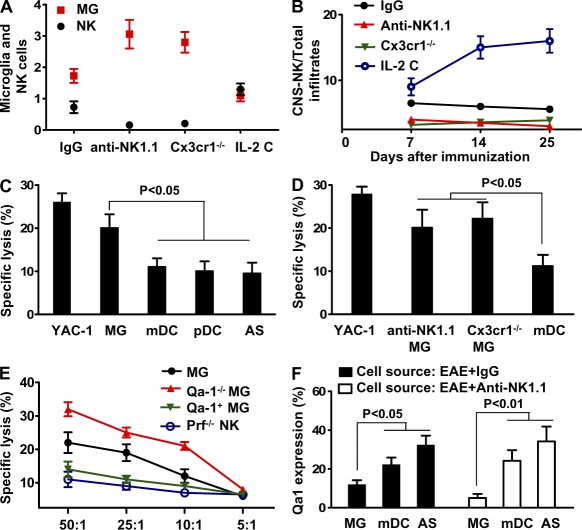
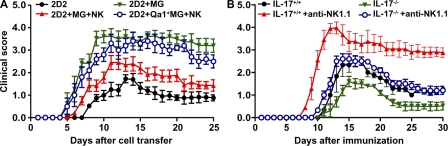
Natural killer (NK) cells of the innate immune system can profoundly impact the development of adaptive immune responses. Inflammatory and autoimmune responses in anatomical locations such as the central nervous system (CNS) differ substantially from those found in peripheral organs. We show in a mouse model of multiple sclerosis that NK cell enrichment results in disease amelioration, whereas selective blockade of NK cell homing to the CNS results in disease exacerbation. Importantly, the effects of NK cells on CNS pathology were dependent on the activity of CNS-resident, but not peripheral, NK cells. This activity of CNS-resident NK cells involved interactions with microglia and suppression of myelin-reactive Th17 cells. Our studies suggest an organ-specific activity of NK cells on the magnitude of CNS inflammation, providing potential new targets for therapeutic intervention.


Figures

Figure 1.
Figure 1.
NK cells control the magnitude of CNS inflammation. (A) Microscopy of CNS sections from MOG-immunized mice that received control IgG or anti-NK1.1 mAb. H&E (left) and luxol fast blue (right) staining reveals the intensity of cell infiltration and myelin integrity, respectively. Graphs show quantified data. Bars, 100 µm. (B) Visualization and quantification of brain inflammation by in vivo bioluminescence imaging. Graphs show quantified data. (C) T2-weighted periventricular images were obtained with a 7T MR scanner. Arrows indicate focal lesions located around the lateral ventricle and increased signal intensity on T2-weighted lesions. Pathology and imaging experiments were conducted in groups of mice (n = 4–8) between 15 and 20 d after immunization. P-values were determined by a Student’s t test. Data are representative of two independent experiments (mean ± SEM).
Figure 2.
Figure 2.
Influence of NK cell depletion or impaired homing of NK cells to the CNS on myelin-reactive Th1 and Th17 cell responses in the periphery and the CNS. Groups of mice (receiving mouse IgG or anti-NK1.1 mAb, and Cx3cr1+/+ or Cx3cr1−/−) were immunized with MOG/CFA/PT and sacrificed between days 12 and 20 after immunization. Lymph node (LN), spleen, and CNS cells were isolated. (A) Expansion of CD4+ T cells from lymphoid organs or CNS was assessed by CFSE dilution or BrdU incorporation assay, respectively. (B) Lymphoid or CNS cells were restimulated with MOG overnight, and IFN-γ– and IL-17–expressing CD4+ T cells were measured by intracellular staining. (C) Il-17a mRNA of sorted CD4+ T cells was measured by qRT-PCR. Data are representative of four independent experiments (n = 18–25/group). Error bars represent the means ± SEM. P = 0.007 and 0.006 for IL-17–expressing CD4+ cells (Student’s t test).
Figure 3.
Figure 3.
Frequencies and phenotype of NK cells in MOG-immunized mice treated with IL-2 complexes. Upon EAE induction with MOG, B6 mice were treated with control IgG, IL-2, anti–IL-2 mAb (S4B6), or a combination of IL-2 and anti–IL-2 mAb (IL-2 C) i.p. as indicated in Materials and methods. Single cell suspensions were prepared from the spleen and CNS of mice on days 12–20, and the frequencies and phenotypes of mononuclear cells were analyzed by FACS. (A) The frequencies of NK and NKT cells in the periphery and CNS. (B) Expression of NKG2A on NK cells. (C) Production of IFN-γ by NK cells. P-values were determined by a Student’s t test. The dot plots are representative of three separate experiments (n = 5–15/group). Error bars represent the means ± SEM.
Figure 4.
Figure 4.
IL-2 complexes attenuate EAE and silence Th17 cell responses in the CNS. (A) Effect of IL-2 complexes on the development and progression of EAE. n = 12–16/group. Data are pooled from three independent experiments. P < 0.01 between days 9 and 21 and P < 0.05 between days 22 and 30 (Mann-Whitney U test). (B and C) Effects of IL-2 complexes on the development and progression of EAE in mice that received anti-NK1.1 mAb (B; n = 8/group) or in Cx3cr1−/− mice (C; n = 8–12/group). Data are pooled from two independent experiments. Error bars represent the means ± SEM. P > 0.05 for any time point (Mann-Whitney U test). (D) Cellular infiltration (top) and demyelination (bottom) were analyzed using CNS sections harvested from days 12–20 after immunization. Bars, 100 µm. (E) Visualization and quantification of brain inflammation by in vivo bioluminescence imaging at day 15 after immunization. (F) In vivo MRI brain images of mice treated with IgG or IL-2 complexes (IL-2 C) showed a decrease in inflammation and demyelination in IL-2 complex–treated mice. Focal lesions (arrows) were located around the lateral ventricle in IgG-treated mice and increased signal intensity on T2-weighted lesions, which were attenuated in IL-2 complex–treated mice. Data from D–F are representative of two independent experiments (n = 4–6/group). Error bars represent the means ± SEM. P-values were determined by a Student’s t test. (G) Lymphoid or CNS cells were restimulated with MOG overnight, and IFN-γ– and IL-17–expressing CD4+ T cells were measured by intracellular staining. (H and I) qRT-PCR of IFN-γ and IL-17 transcripts from sorted CD4+ T cells. Data from G–I are representative of four independent experiments (n = 6–12/group). Error bars represent the means ± SEM. P-values were determined by a Student’s t test.
Figure 5.
Figure 5.
Effects of NK cells on the capacity of microglia and other CNS-derived APCs to promote myelin-reactive T cell proliferation and Th17 responses. (A) Proliferation of naive CD62Lhigh MOG35-55-specific CD4+ transgenic 2D2 T cells cultured with microglia, astrocytes (AS), mDCs, pDCs, CD11b+CD45+, or irradiated CD4 splenocytes from MOG-primed mice at the peak of EAE disease at an APC/T cell ratio of 5:1, in the presence or absence of 10 µg/ml MOG35-55 peptide. Mice were treated with control IgG or anti-NK1.1 before immunization. Results are expressed as the changes in counts per minute (CPM). Irradiated CD4 splenocytes stimulate 2D2 cells at 2/3 of the capacity of mDCs. (B) Release of IL-17 by T helper cell supernatant from A after 72 h. (C) Capacity of CNS-derived APCs to drive Th17 cell responses and to be affected by NK cells. Naive (CD25CD62LhighCD44low) CD4+ T cells were sorted from lymph nodes and spleens of 2D2 transgenic mice. Subsequently, 2 × 10⁵ cells of the indicated APC types and NK cells (all isolated from the CNS) were added to the culture. NK cells from the IL-2 complex–treated mice were injected into the brain. Il-17a transcripts were quantified by qRT-PCR. Data in A–C are representative of two independent experiments using cells from 15–20 mice/group. MG, microglia. Error bars represent the means ± SEM. P-values were determined by an ANOVA test. (D) Interactions between NK cells and microglia influence myelin-reactive Th17 cells in vivo and the importance of the NKG2A–Qa1 pathway. Naive (CD25CD62LhighCD44low) CD4+ T cells were sorted from lymph nodes and spleens of 2D2 mice. Subsequently, 2 × 10⁵ cells were injected i.v. into MOG/CFA/PT-primed RAG1−/−γc−/− mice. Simultaneously, the same numbers of microglia from Cx3cr1+/− (MG+/−) and Cx3cr1−/− (MG−/−) mice and NK cells from the IL-2 complex–treated mice were injected into the brain as previously described (Cardona et al., 2006b). STAT3 phosphorylation was quantified by FACS and compared in mice receiving CD4+ T cells alone or mice that also received microglia from Cx3cr1+/− or Cx3cr1−/− mice. RNA was isolated from 2D2 CD4+ cells and Rorα, Rorγ (also know as Rorc), and Il-17a transcripts were quantified by qRT-PCR. Data represent three experiments with 15–22 mice per group each. Error bars represent the means ± SEM. P-values wre determined by an ANOVA test. For C and D, + and − denote culture with or without NK cells.
Figure 6.
Figure 6.
Reciprocal chemoattraction between NK cells and microglia. (A) Colocalization of NK cells and microglia. Cx3cr1GFP+/− mice were immunized with MOG/CFA, brain tissues were harvested during days 12–20 after immunization, and CNS sections were made. NK cells and GFP+ microglia (green) were visualized with anti-NK1.1 or -NKp46 (red). Representative images of four independent experiments with four mice per group each are shown. Bar, 10 µm. (B, left) MIP-1α release by 2 × 10⁵ NK cells isolated from lymph node (LN) of naive or MOG-challenged mice and from the CNS during the peak of EAE in mice. (B, right) MCP-1 release from 2 × 10⁵ CNS-derived APCs isolated during the peak of EAE. Chemokines were detected by ELISA in cell culture supernatant of the corresponding cells without stimulation. Results are representative of three similar experiments in which cells from 15–20 perfused donor mice were pooled and each APC subset was analyzed three times. Error bars represent the means ± SEM. P-values were determined by an ANOVA test. (C, top) CNS-infiltrating NK cells recruit microglia in an MIP-1α–dependent manner. NK cells induced a substantial recruitment of purified microglia in transwell experiments. Medium only was used as a control. Anti–MIP-1α antibody or MIP-1α was added as indicated. 2 × 10⁵ microglia were added to the upper chamber. (C, bottom) Supernatants from microglia recruit NK cells in a MCP-1–dependent manner. Chemotaxis of purified CNS-infiltrating NK cells toward chemokines produced by microglia was tested by using a transwell assay. Supernatants collected from purified microglia were stimulated with PMA and were added to the lower chambers of transwell plates. Medium only was used as a control. Anti–MCP-1 antibody or MCP-1 was added as indicated. 2 × 10⁵ NK cells were added to the upper chamber. Specific migration was calculated as migration index. Bars represent means of triplicate wells from a representative of three independent experiments. Error bars represent the means ± SEM. P values were determined by a Student’s t test. (D) Morphological features of microglia and their proximity to inflammatory foci when NK cells are manipulated. Cx3cr1GFP+/−, Cx3cr1−/−, and Cx3cr1+/+ mice, with microglia labeled with GFP, were immunized with MOG/CFA. A portion of the +/− mice was treated with control IgG, anti-NK1.1 mAb, or IL-2 complexes. Brain tissues were harvested during days 12–20 after immunization. Morphological features of microglia in relation to NK cells were analyzed by confocal microscopy. Activated microglia (increased size of cell body and thickening of proximal processes) were noted at a higher prevalence in control mice. A significantly higher level of reactive oxygen species (ROS; denoting areas of inflammation) was noted in NK cell–deleted mice, whereas the IL-2 complex treatment group had a lower level of ROS compared with control mice. Representative images of three independent experiments with four mice per group each are shown. Bars, 10 µm.
Figure 7.
Figure 7.
Missing self on microglia breaks NK cell tolerance. (A and B) Inverse relationship between NK cells and microglia. CNS infiltrates were isolated from MOG/CFA-primed Cx3cr1 GFP+/− mice after treatment with control IgG, anti-NK1.1 mAb, or IL-2 complexes. (A) Numbers of NK cells (×105) and GFP+ microglia (×106) that were analyzed by FACS. (B) Ratio of CNS-resident NK cells and total CNS infiltrates. P < 0.01 for comparisons of microglial cell numbers from each experimental group with that from control mice. P < 0.01 for comparisons of the ratios of CNS-derived NK cells/total infiltrates from the groups that received IL-2 C with that from the remaining groups. P < 0.05 for comparisons between groups of mice that received IgG and groups that received anti-NK1.1, or groups of Cx3cr1−/− mice. (C) NK cells principally target microglia. NK cells were purified from pools of CNS tissues harvested from MOG-immunized mice treated with IL-2 complexes. Microglia, astrocytes, mDCs, and pDCs were isolated from MOG-primed Cx3cr1+/− mice and incubated with 51Cr. The effector (NK) and target (microglia) cells (5 × 10⁴) were incubated at E:T ratios of 25:1 and cytolytic effects were measured in a 4-h 51Cr-release assay, as previously described (Shi et al., 2000). (D) Microglia, astrocytes, and mDCs were isolated from MOG-primed Cx3cr1+/− mice or Cx3cr1−/− mice and incubated with 51Cr. The effector (NK) and target (5 × 10⁴) cells were transferred into RAG1−/−γc−/− mice and a rapid elimination assay (see Materials and methods) was performed. (E) Role of the NKG2A–Qa1 pathway in the interaction between NK cells and microglia. Cytotoxicity assay was conducted with effector NK cells from MOG/CFA-primed WT or perforin-deficient mice. Target cell microglia were isolated from Cx3cr1+/− mice, Qa1/Cx3xr1 double-deficient mice (Qa1−/− MG), or with microglia overexpressing Qa1 (Qa-1+ MG). MG denotes microglia isolated from MOG/CFA-primed Cx3cr1−/− mice. Qa1+MG denotes overexpression of Qa1 on microglia from Qa1−/− mice (see Materials and methods). Data regarding the killing activity of NK cells from the CNS of WT animals with EAE were not available, as it was technically challenging to purify sufficient numbers of NK cells to perform the assay. (F) Expression of Qa1 on CNS-derived APCs in the presence or absence of NK cells. CNS-derived cells (days 12–20 after immunization) from MOG-immunized mice treated with IgG or anti-NK1.1 were analyzed for Qa1 expression by FACS. All data are representative of two to three independent experiments with 12–18 mice per group each (mean ± SEM). P-values were determined by an ANOVA test.
Figure 8.
Figure 8.
Interactions between NK cells, microglia, and Th17 cells influence the expression of EAE. (A) CD4+ T cells were sorted from the lymph nodes and spleen of 2D2 transgenic mice and cultured under conditions for EAE induction (see Materials and methods). Subsequently, 2 × 10⁵ cells were injected i.v. into MOG/CFA/PT-primed RAG1−/−γc−/− mice. Simultaneously, the same numbers of microglia from Cx3cr1+/− or Cx3cr1−/− mice and NK cells from the IL-2 complex–treated mice were injected into the brain as previously described (Cardona et al., 2006b). In some experiments, Qa1 was overexpressed on microglia with a lentiviral vector (see Materials and methods). Development of EAE in the recipient mice was monitored and compared. P < 0.05 after day 10 after cell transfer (Mann-Whitney U test) for comparisons between groups receiving 2D2 cells versus 2D2 cells with microglia (except for the group receiving Qa1 overexpressing microglia) and for groups receiving 2D2 cells with microglia versus 2D2 cells with microglia + NK cells. P > 0.05 (Mann-Whitney U test) at all time points for comparisons among the groups of mice receiving 2D2 cells versus 2D2 cells with microglia and NK cells and for groups receiving untransfected versus Qa1-transfected microglia. n = 8–12/group. Error bars represent the means ± SEM. (B) Anti-NK1.1 mAb fails to dramatically alter the course of EAE in IL-17–deficient mice. WT and IL-17−/− mice were immunized with MOG/CFA. Groups of the immunized mice also received anti-NK1.1 mAb or control IgG (see Materials and methods) upon immunization. Development of EAE was monitored and compared. P < 0.05 after day 10 (Mann-Whiteney U test) for comparisons between IL17+/+ mice that received anti-NK1.1 mAb and all of the other groups. P > 0.05 (Mann-Whitney U test) at all time points for comparisons among the remaining groups except for IL-17+/+ mice that received anti-NK1.1 mAb. n = 12–15/group. Error bars represent the means ± SEM. Data from A and B are pooled from three similar experiments.

References

    1. Abizaid A., Liu Z.W., Andrews Z.B., Shanabrough M., Borok E., Elsworth J.D., Roth R.H., Sleeman M.W., Picciotto M.R., Tschöp M.H., et al. 2006. Ghrelin modulates the activity and synaptic input organization of midbrain dopamine neurons while promoting appetite. J. Clin. Invest. 116:3229–3239 10.1172/JCI29867 - DOI - PMC - PubMed
    1. Assarsson E., Kambayashi T., Schatzle J.D., Cramer S.O., von Bonin A., Jensen P.E., Ljunggren H.G., Chambers B.J. 2004. NK cells stimulate proliferation of T and NK cells through 2B4/CD48 interactions. J. Immunol. 173:174–180 - PubMed
    1. Bailey S.L., Schreiner B., McMahon E.J., Miller S.D. 2007. CNS myeloid DCs presenting endogenous myelin peptides ‘preferentially’ polarize CD4+ T(H)-17 cells in relapsing EAE. Nat. Immunol. 8:172–180 10.1038/ni1430 - DOI - PubMed
    1. Banchereau J., Steinman R.M. 1998. Dendritic cells and the control of immunity. Nature. 392:245–252 10.1038/32588 - DOI - PubMed
    1. Bettelli E., Baeten D., Jäger A., Sobel R.A., Kuchroo V.K. 2006a. Myelin oligodendrocyte glycoprotein-specific T and B cells cooperate to induce a Devic-like disease in mice. J. Clin. Invest. 116:2393–2402 10.1172/JCI28334 - DOI - PMC - PubMed

Publication types