. 2010 Oct 22;285(43):32760-32769.
doi: 10.1074/jbc.M109.098228. Epub 2010 Aug 9.

Mechanism of regulation of native cardiac muscle thin filaments by rigor cardiac myosin-S1 and calcium

Affiliations

Mechanism of regulation of native cardiac muscle thin filaments by rigor cardiac myosin-S1 and calcium

Ahmed Houmeida et al. J Biol Chem. .

Abstract

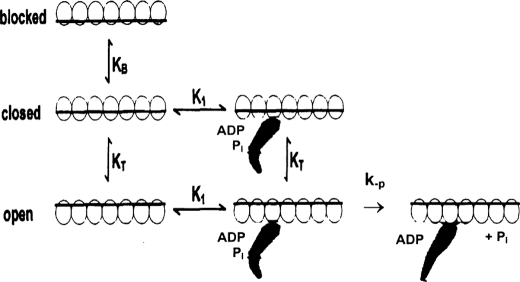
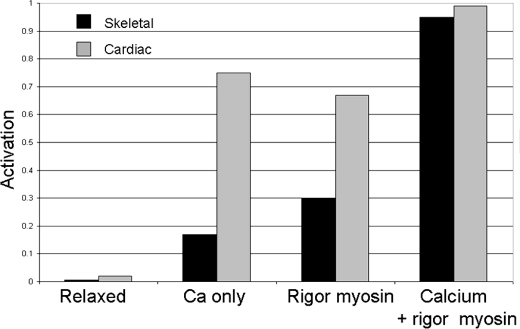
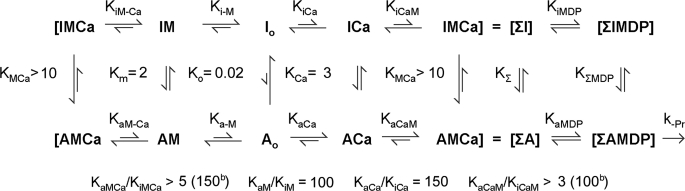
We have studied the mechanism of activation of native cardiac thin filaments by calcium and rigor myosin. The acceleration of the rate of 2'-deoxy-3'-O-(N-methylanthraniloyl)ADP (mdADP) dissociation from cardiac myosin-S1-mdADP-P(i) and cardiac myosin-S1-mdADP by native cardiac muscle thin filaments was measured using double mixing stopped-flow fluorescence. Relative to inhibited thin filaments (no bound calcium or rigor S1), fully activated thin filaments (with both calcium and rigor-S1 bound) increase the rate of product dissociation from the physiologically important pre-power stroke myosin-mdADP-P(i) by a factor of ∼75. This can be compared with only an ∼6-fold increase in the rate of nucleotide diphosphate dissociation from nonphysiological myosin-mdADP by the fully activated thin filaments relative to the fully inhibited thin filaments. These results show that physiological levels of regulation are not only dependent on the state of the thin filament but also on the conformation of the myosin. Less than 2-fold regulation is due to a change in affinity of myosin-ADP-P(i) for thin filaments such as would be expected by a simple "steric blocking" of the myosin-binding site of the thin filament by tropomyosin. Although maximal activation requires both calcium and rigor myosin-S1 bound to the cardiac filament, association with a single ligand produces ∼70% maximal activation. This can be contrasted with skeletal thin filaments in which calcium alone only activated the rate of product dissociation ∼20% of maximum, and rigor myosin produces ∼30% maximal activation.


Figures

FIGURE 1.
FIGURE 1.
SDS-PAGE of native porcine cardiac thin filaments. Lanes from left to right contain molecular weight markers and 15 μg of native cardiac thin filaments. The two tropomyosin bands correspond to α (lower) and β (upper) isoforms. The unlabeled band is a consistent trace impurity.
FIGURE 2.
FIGURE 2.
Hydrolysis of mdATP by cardiac S1 by quench flow. A, 100 μm cardiac S1 was mixed with 20 μm mdATP in 5 mm MOPS, 2 mm MgCl2, 20 mm potassium acetate, pH 7.0, 20 °C. The solid line drawn through the data is a fit to the curve: I(t) = 0.55 e−13t + 0.37 e−0.043t. B, dependence of kobs upon [S1] is fit to the equation kobs = (kH + k−H)/(1 + K1/[S1]), in which K1 = 50 μm; kH = 21 s−1; k−H = 14 s−1.
FIGURE 3.
FIGURE 3.
Effect of calcium and rigor myosin S1 on the kinetics of product dissociation from cardiac acto(TnTm)myosin S1-mdADP-Pi. Double mixing stopped-flow experiments were performed as described under “Experimental Procedures.” A and B, 2 μm cardiac S1 and 3 μm mdATP were mixed, incubated for 2 s, and then mixed with 47 μm (actin subunit concentration) cardiac thin filaments containing 2 mm MgATP and either 1.0 mm EGTA (A) or 0.5 mm CaCl2 (B). Final concentrations in the flow cell are as follows: 0.44 μm cardiac S1, 0.67 μm nucleotide, 26 μm cardiac thin filaments, 1.1 mm MgATP, 2 mm MgCl2, 5 mm MOPS, and either 0.55 mm EGTA (A) or 0.27 mm CaCl2 (B), pH 7, 20 °C. C and D, 19 μm of cardiac S1 and 2 μm mdATP were mixed, incubated for 2 s, and then mixed with cardiac thin filaments containing either 1.0 mm EGTA (C) or 0.5 mm CaCl2 (D). Final concentrations in the flow cell are as follows: 3.7 μm cardiac S1, 0.44 μm nucleotide, 26 μm cardiac thin filaments, 2 mm MgCl2, 5 mm MOPS, and either 0.55 mm EGTA (C) or 0.27 mm CaCl2 (D), pH 7, 20 °C. The solid lines through the data are the best fits to the following exponential equations: A, I(t) = 1.0e−0.37t + C; B, I(t) = 0.34e−19t + 0.66e−1.7t + C; C, I(t) = 0.71e−15t + 0.29e−1.8t + C; D, I(t) = 0.76e−25t + 0.24e−1.9t + C.
FIGURE 4.
FIGURE 4.
Dependence of the rates of product dissociation from cardiac acto(TnTm)myosin S1-mdADP-Pi on thin filament concentration and calcium and rigor S1 bound to the thin filaments. Experiments are similar to those described in Fig. 3 except that the concentration of thin filaments was varied as indicated. The dependence of kobs of thin filament (actin subunit) concentration is fit to the equation kobs = kfast(1 + (KTF/[TF])). For pCa > 7 (♢), kfast = 0.49 ± 0.05 s−1, KTF = 16 μm; pCa < 4 (■), kfast = 27 ± 4 s−1, KTF = 19 μm; pCa > 7 + rigor (▴), kfast = 24 ± 4 s−1, KTF = 11 μm; pCa < 4 + rigor (●), kfast = 36 ± 3 s−1, KTF = 11 μm. In the inset F-actin replaced cardiac thin filaments. The observed rate scale is indicated on the right vertical axis of the inset. Open symbols (○) are the fast component of experiments measuring the decrease in md nucleotide fluorescence. The line fit through the data is for a hyperbola in which Kactin = 53 μm and kfast = 38 ± 4 s−1. Solid symbols (●) are the fast component of experiments in which phosphate dissociation was measured using fluorescent phosphate-binding protein. The line fit through the data is for a hyperbola in which Kactin = 48 μm are kfast = 30 ± 5 s−1.
SCHEME 1.
SCHEME 1.
FIGURE 5.
FIGURE 5.
Effect of calcium and rigor myosin S1 on the kinetics of mdADP dissociation from cardiac acto(TnTm)myosin S1. A and B, double mixing stopped-flow experiments were performed as described under “Experimental Procedures.” 4 μm cardiac S1 and 2 μm mdADP were mixed, incubated for 2 s, and then mixed with cardiac thin filaments containing 2 mm MgATP and either 2.0 mm EGTA (A) or 0.2 mm CaCl2 (B). Final concentrations in the flow cell are as follows: 0.88 μm cardiac S1, 0.44 μm mdADP, 32 μm cardiac thin filaments, 1.1 mm ATP, 2 mm MgCl2, 5 mm MOPS, and either 1.1 mm EGTA (A) or 0.11 mm CaCl2 (B), pH 7, 20 °C. C and D, 20 μm cardiac S1 and 2 μm mdADP were mixed, incubated for 2 s, and then mixed with cardiac thin filaments containing either 2.0 mm EGTA (A) or 0.2 mm CaCl2 (B). Final concentrations in the flow cell are as follows: 4.5 μm cardiac S1, 0.44 μm nucleotide, 32 μm cardiac thin filaments, 2 mm MgCl2, 5 mm MOPS, and either 1.1 mm EGTA (C) or 0.11 mm CaCl2 (D), pH 7, 20 °C. The solid lines through the data are the best fit to single exponential equations in which kobs = 15.7 s−1 (A), 250 s−1 (B), 153 s−1 (C), and 290 s−1 (D).
FIGURE 6.
FIGURE 6.
Dependence of the rates of product dissociation from cardiac acto(TnTm)myosin S1-mdADP on thin filament concentration and calcium and rigor S1 bound to the thin filaments. Experiments are similar to those described in Fig. 5 except that the concentration of thin filaments was varied as indicated. The solid lines through the data are best fits to a hyperbolic equation: kobs = k−AD(1 + (KTF/[TF])). For pCa > 7 (♢), k−AD = 64 s−1, KTF = 32 μm; pCa < 4 (■), k−AD = 357 s−1, KTF = 12 μm; pCa > 7 + rigor (▴), k−AD = 332 s−1, KTF = 27 μm; pCa < 4 + rigor (●), k−AD = 359 s−1, KTF = 6 μm.
FIGURE 7.
FIGURE 7.
Measurement of cardiac myosin S1 binding to cardiac thin filaments in the presence of MgATP at high (pCa < 4) and low calcium (pCa > 7) by active enzyme centrifugation. Experimental conditions are as follows: final concentrations in the centrifuge tube were 0.2 μm cardiac myosin S1, 5 mm MOPS, 2 mm MgCl2, 1.0 mm MgATP, either 0.2 mm CaCl2 or 1.0 mm EGTA, and the indicated concentration of porcine thin filaments (actin subunit concentration). The amount of cardiac myosin S1 in the supernatant was determined by enzymatic activity as described under “Experimental Procedures.” Solid lines through the data are fit to fsupernatant = Vo/(1 + ([actin]/Kbind)), where Vo = ATPase rate before spinning with thin filaments, and Kbind = 3.2 μm in 0.2 mm CaCl2 (■) and 8.5 μm in 1 mm EGTA (□).
FIGURE 8.
FIGURE 8.
Three state mechanism of thin filament regulation showing blocked, closed, and open states.
FIGURE 9.
FIGURE 9.
Comparison of the activation of cardiac and skeletal thin filaments on rigor and calcium. Dependence of the extent of activation by cardiac (gray) and skeletal (black) thin filaments on calcium (pCa < 4) and 1 rigor myosin/7 actin subunits. Activation is the maximum rate of the fast component of mdADP dissociation from acto(TnTm)myosin-md ADP-Pi at the indicated conditions (Fig. 4, inset) (20) normalized relative to the maximum extrapolated rate of mdADP dissociated from unregulated actomyosin-mdADP-Pi.
SCHEME 2.
SCHEME 2.
A, active thin filament conformation (accelerates product dissociation from M-ADP-Pi); I is inactive thin filament conformation (does not accelerate product release from M-ADP-Pi); subscripts to equilibrium constants i = inactive thin filament conformation and a = active thin filament conformation; if neither i nor a is indicated the equilibrium constant is the apparent equilibrium constant [A(Ca,M)]/[I(Ca,M)], with the indicated ligands bound to the thin filament (e.g. KCa is the equilibrium between A and I with calcium bound to the thin filament, and KiCa is the association constant for calcium binding to the inactive filaments (I); M = cardiac S1; Ca = calcium; the second subscript is the associating/dissociating ligand. ΣA and ΣI are the sum of the active and inactive thin filament regulatory units. The values for the equilibrium constants or ratios of equilibrium constants assuming that the affinity is only a function of the thin filament conformation and not of the bound ligands (i.e. KiCa = KiMCa, KaCa = KaMCa, KiM = KiCaM, and KaM = KaCaM) are shown in parentheses.

References

    1. Cohen C. (1975) Sci. Am. 233, 36–45 - PubMed
    1. Ohtsuki I. (1979) J. Biochem. 86, 491–497 - PubMed
    1. Mak A. S., Smillie L. B. (1981) J. Mol. Biol. 149, 541–550 - PubMed
    1. Flicker P. F., Phillips G. N., Jr., Cohen C. (1982) J. Mol. Biol. 162, 495–501 - PubMed
    1. Cabral-Lilly D., Tobacman L. S., Mehegan J. P., Cohen C. (1997) Biophys. J. 73, 1763–1770 - PMC - PubMed

Publication types

LinkOut - more resources