. 2010 Oct 15;285(42):32160-73.
doi: 10.1074/jbc.M110.153676. Epub 2010 Aug 9.

A new Kv1.2 channelopathy underlying cerebellar ataxia

Affiliations

A new Kv1.2 channelopathy underlying cerebellar ataxia

Gang Xie et al. J Biol Chem. .

Abstract

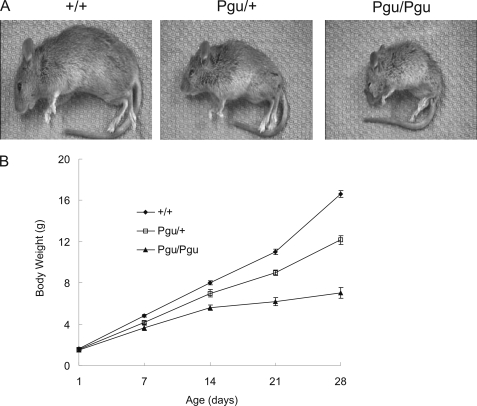
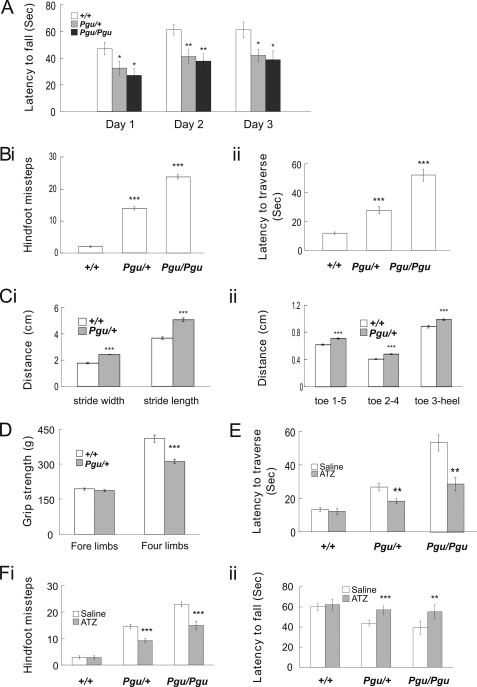
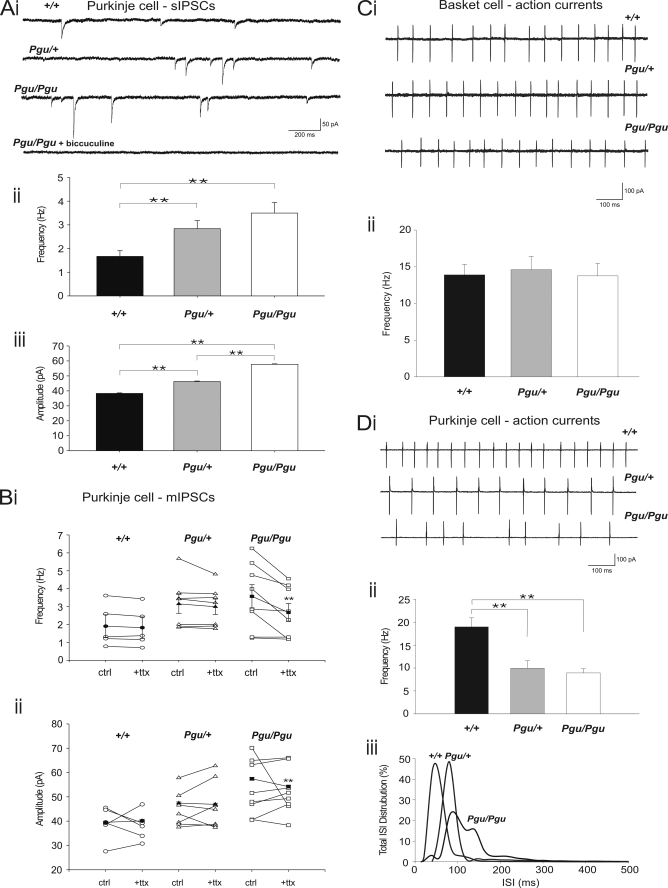
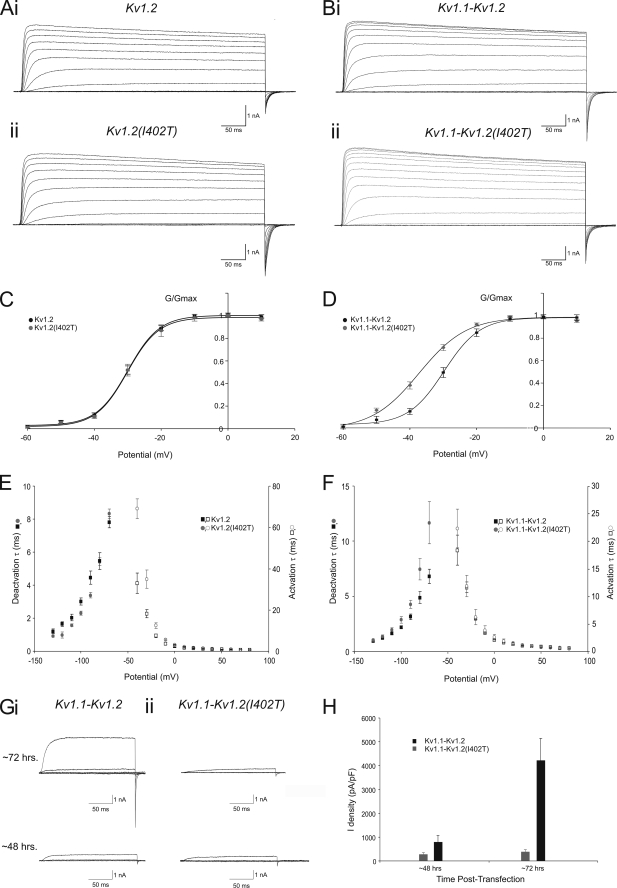
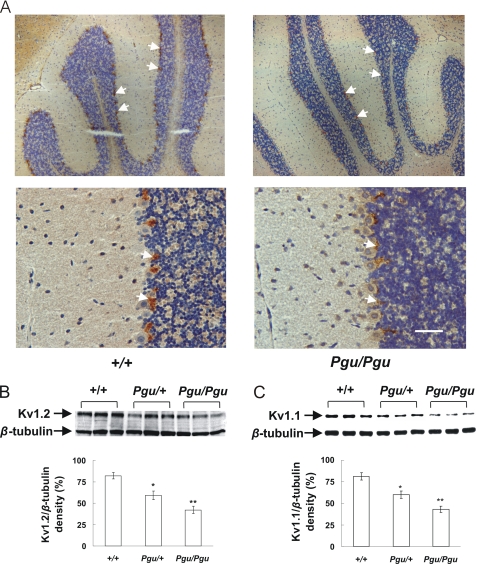
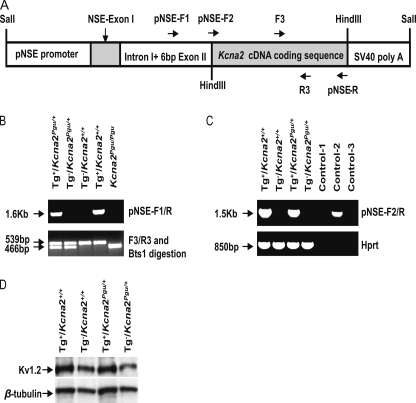
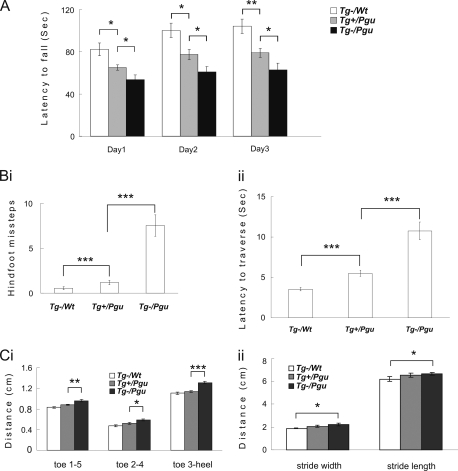
A forward genetic screen of mice treated with the mutagen ENU identified a mutant mouse with chronic motor incoordination. This mutant, named Pingu (Pgu), carries a missense mutation, an I402T substitution in the S6 segment of the voltage-gated potassium channel Kcna2. The gene Kcna2 encodes the voltage-gated potassium channel α-subunit Kv1.2, which is abundantly expressed in the large axon terminals of basket cells that make powerful axo-somatic synapses onto Purkinje cells. Patch clamp recordings from cerebellar slices revealed an increased frequency and amplitude of spontaneous GABAergic inhibitory postsynaptic currents and reduced action potential firing frequency in Purkinje cells, suggesting that an increase in GABA release from basket cells is involved in the motor incoordination in Pgu mice. In line with immunochemical analyses showing a significant reduction in the expression of Kv1 channels in the basket cell terminals of Pgu mice, expression of homomeric and heteromeric channels containing the Kv1.2(I402T) α-subunit in cultured CHO cells revealed subtle changes in biophysical properties but a dramatic decrease in the amount of functional Kv1 channels. Pharmacological treatment with acetazolamide or transgenic complementation with wild-type Kcna2 cDNA partially rescued the motor incoordination in Pgu mice. These results suggest that independent of known mutations in Kcna1 encoding Kv1.1, Kcna2 mutations may be important molecular correlates underlying human cerebellar ataxic disease.


Figures

FIGURE 1.
FIGURE 1.
Pgu mice showed severe postnatal growth retardation. A, shown are the body sizes of a heterozygous Pgu/+, a homozygous Pgu/Pgu mouse, and their +/+ littermate at postnatal day 21. B, shown is a comparison of the body weight between Pgu/+, Pgu/Pgu mice, and +/+ controls from P1 to P28 (supplemental Table 1).
FIGURE 2.
FIGURE 2.
Positional cloning of the Pgu mutation. A, high resolution haplotype mapping of Pgu mutation on mouse chromosome 3 (Chr. 3) is shown. White squares indicate C3H homozygotes; gray squares indicate B6/C3H heterozygotes. The SNPs defining the minimal interval are shown in bold text. Map positions are in accordance with the public mouse genome assembly (Ensembl). B, shown is sequencing of mouse candidate Kcna2 cDNA revealed a T-to-C transition at nucleotide residue 1886, leading an isoleucine to threonine substitution at residue 402 in Pgu/+ and Pgu/Pgu mice. C, shown is a protein sequence alignment of the S6 transmembrane domain (bold text) of the voltage-gated potassium channel Kv1 subfamily in human and mouse genome. The Pgu I402T mutation is indicated by an arrow.
FIGURE 3.
FIGURE 3.
Motor coordination deficits in Pgu mice. A, latency to fall off the accelerating rotarod is shown. Results were averaged over three trials each day for three consecutive days (supplemental Table 2). Hind-foot missteps on the balance beam (Bi) and latency to traverse the beam (Bii) are shown (supplemental Table 2). Hind-limb footprint analysis of stride width (Ci) and stride length and toe spread (Cii) are shown (supplemental Table 3). D, grip strength of the fore limbs and all four limbs is shown. E, intraperitoneal injection of ATZ significantly increased the latency to fall in Pgu mutant mice compared with the injection of saline (supplemental Table 4). F, i and ii, balance beam performance improved in Pgu mice after injection of ATZ compared with injection of saline is shown (supplemental Table 4). *, p < 0.05; **, p < 0.01; ***, p < 0.001.
FIGURE 4.
FIGURE 4.
Increased frequency and amplitude of sIPSCs and reduced AP firing rates in cerebellar Purkinje cells from Pgu mice in the cerebellar slice. Ai, representative traces from cerebellar Purkinje cells show sIPSCs in +/+, Pgu/+, and Pgu/Pgu mice and block of sIPSCs in a Pgu/Pgu mouse with bicuculline (10 μm). Data were recorded in the presence of NBQX (10 μm). Holding potential was −60 mV. Scale bar, 50 pA, 200 ms. Aii, frequency of sIPSCs in +/+, Pgu/+, and Pgu/Pgu mice is shown (+/+ 1.67 ± 0.24 Hz, n = 13 versus Pgu/+ 2.84 ± 0.34 Hz, n = 14, p = 0.008; +/+ versus Pgu/Pgu 3.50 ± 0.45 Hz, n = 20, p = 0.003). Aiii, amplitude of sIPSCs in +/+, Pgu/+, and Pgu/Pgu mice (+/+ 38.27 ± 0.37 pA, n = 13 versus Pgu/+ 46.22 ± 0.35 pA, n = 14, p < 0.0001; +/+ versus Pgu/Pgu 57.77 ± 0.32 pA, n = 20, p = 0.001). Bi, frequency of sIPSCs (ctrl) compared with mIPSCs (+ttx) recorded in the presence of NBQX (10 μm) in +/+, Pgu/+, and Pgu/Pgu mice frequency is shown (+/+ sIPSCs 1.90 ± 0.64 Hz, n = 6 versus mIPSCs 1.83 ± 0.60 Hz, n = 6, p = 0.21; Pgu/+ sIPSCs 3.15 ± 0.53 Hz, n = 7 versus mIPSCs 2.99 ± 0.43 Hz, n = 7, p = 0.8; Pgu/Pgu sIPSCs 3.57 ± 0.65 Hz versus mIPSCs 2.67 ± 0.50 Hz, n = 8, p = 0.007). Bii, amplitude of sIPSCs (ctrl) compared with mIPSCs (+ttx) in +/+, Pgu/+, and Pgu/Pgu mice (+/+ sIPSCs 39.51 ± 0.47 pA, n = 6 versus mIPSCs 40.12 ± 0.49 pA, n = 6, p = 0.37; Pgu/+ sIPSCs 47.43 ± 0.45 pA, n = 7 versus mIPSCs 46.9 ± 0.47, n = 7, p = 0.415; Pgu/Pgu sIPSCs 57.4 ± 0.5 pA versus mIPSCs 54.2 ± 0.58 pA, n = 8, p < 0.0001). Ci, representative traces are shown of cell-attached action currents from cerebellar basket cells in +/+, Pgu/+, and Pgu/Pgu mice. Holding potential, −60 mV. Scale bar, 100 pA, 100 ms. Cii, frequency of action currents from cerebellar basket cells in +/+, Pgu/+, and Pgu/Pgu mice. Di, representative traces are shown of cell-attached action currents from cerebellar Purkinje cells in +/+, Pgu/+, and Pgu/Pgu mice. Holding potential was −60 mV. Scale bar, 100 pA, 100 ms. Dii, frequency of action currents from cerebellar Purkinje cells in +/+, Pgu/+, and Pgu/Pgu mice is shown. Diii, interspike interval distribution for +/+, Pgu/+, and Pgu/Pgu mice. *, p = 0.05, **, p < 0.005.
FIGURE 5.
FIGURE 5.
The Kv1.2 I402T missense mutation results in gating, kinetic, and surface expression level changes in homomeric and heteromeric channels that contain the Kv1. 2(I402T) α-subunit in CHO cells. A, shown are representative currents, recorded from a CHO cell expressing either Kv1.2 (Ai) or Kv1.2(I402T) (Aii) 48 h post-transfection using +10-mV incrementing steps to +60 mV from a holding potential of −90 mV. Scale bar, 1 nA, 50 ms. B, representative currents, recorded from a CHO cell expressing either Kv1.1 (Bi) and Kv1.2 or Kv1.1 and Kv1.2(I402T) (Bii) 48 h post-transfection using +10-mV incrementing steps to +60 mV from a holding potential of −90 mV. Scale bar, 1 nA, 50 ms. C, shown are the mean g/gmax-voltage relationship for whole cell, voltage-clamped CHO cells expressing Kv1.2 (n = 10, black squares) or Kv1.2(I402T) (n = 10, grey circles). The Boltzmann functions shown superimposed on the data points gave the V½ and slope values quoted under “Results.” D, shown are the mean g/gmax-voltage relationship for whole cell, voltage-clamped CHO cells expressing Kv1.1 and Kv1.2 (n = 10, black squares) α-subunits or Kv1.1 and Kv1.2(I402T) (n = 10, grey circles). The Boltzmann functions shown superimposed on the data points gave the V½ and slope values quoted under “Results.” E, shown are the mean activation and deactivation time constants from whole cell, voltage-clamped CHO cells expressing Kv1.2 (n = 8, black squares) or Kv1.2(I402T) (n = 8, grey circles). F, shown are the mean activation and deactivation time constants from whole cell, voltage-clamped CHO cells expressing Kv1.1 and Kv1.2 (n = 8, black squares) or Kv1.1 and Kv1.2(I402T) (n = 8, grey circles). G, shown are representative currents, recorded from CHO cells expressing either Kv1.1 and Kv1.2 (Gi) or Kv1.1 and Kv1.2(I402T) (Gii) ∼48 and ∼72 h post-transfection using +10-mV incrementing steps to −30 mV from a holding potential of −90 mV. Scale bar, 1 nA, 50 ms. H, shown are mean maximum current density from whole cell, voltage-clamped CHO cells expressing Kv1.1 and Kv1.2 (n = 8, black bars) or Kv1.1 and Kv1.2(I402T) (n = 8, grey bars) after ∼48 and ∼72 h post-transfection.
FIGURE 6.
FIGURE 6.
Reduced expression level of Kv1.2 and Kv1.1 proteins in the cerebellum of Pgu mice. A, polyclonal antibody rabbit anti-Kv1.2 staining of the cerebellum of +/+ and Pgu/Pgu mice, indicated by white arrows, showed a decreased intensity of Kv1.2 antibody staining, within the basket cell axon plexus terminals surrounding the Purkinje cells in Pgu/Pgu mice (the staining in Pgu/+ mice is not shown). B and C, Western blot of the protein extracted from the cerebellum of the adult Pgu mice and +/+ controls and quantitative analysis of the Kv1.2 or Kv1.1/β-tubulin densitometer showed a significant reduction of Kv1.2 and Kv1.1 proteins in Pgu/+ and Pgu/Pgu mice by 28, 26, 48%, and 47%, respectively, compared with +/+ controls (mean ± S.E., n = 6 for each genotype. Kv1.2: +/+ 81.6 ± 3.69 versus Pgu/+ 58.8 ± 5.33, p = 0.024; +/+ versus Pgu/Pgu 42.5 ± 4.26, p = 0.0023. Kv1.1: +/+ 80.9 ± 4.03 versus Pgu/+ 59.6 ± 4.16, p = 0.032; +/+ versus Pgu/Pgu 42.8 ± 3.97, p = 0.0048). *, p < 0.05; **, p < 0.01. The scale bar indicates 50 μm.
FIGURE 7.
FIGURE 7.
Creation of Kcna2 transgenic mice. A, shown is a scheme of a full-length DNA construct used for the generation of transgenic mice showing regions of rat NSE promoter with NSE exon I, intron I, and 6 bp of exon II, wild-type mouse Kcna2 cDNA coding sequence, and a SV40 polyadenylation signal sequence. B, PCR amplification of genomic DNA using the specifically designed primer pair pNSE-F1 and pNSE-R yielded a 1.6-kb DNA product in transgenic positive mice. Genotyping of Kcna2 Pgu mutant was performed by PCR amplification of genomic DNA using the primer pair F3 and R3 followed by digestion of the PCR product with the Bts1 restriction enzyme, yielding DNA fragments of 539 and 466 bp in Pgu/+ mice, 539 bp in wild-type mice, and 466 bp in Pgu/Pgu mice. C, Kcna2 transgenic expression is shown. RNA from the cerebellum was used for RT-PCR analysis using the specific primers pNSE-F2 and pNSE-R for the transgenic Kcna2 mRNA. Transgenic Kcna2 mRNA was expressed in Tg+/Kcna2+/+ and Tg+/ Kcna2Pgu/+ mice but not in non-transgenic mice. Control-1 indicates a PCR reaction using Tg+/ Kcna2Pgu/+ RNA without reverse transcriptase. The genomic DNA from Tg+/ Kcna2Pgu/+ was used as a positive control in control-2. Control-3 is water. Hprt cDNA was amplified as a positive control for cDNA quality. D, shown is a Western blot analysis of cerebellum homogenates obtained from transgenic and non-transgenic wild-type and Kcna2 Pgu/+ mice. β-Tubulin III immunoreactivity was used to ensure that equal amounts of protein were loaded. The quantitative analysis of the Kv1.2/β-tubulin densitometer revealed that Kv1.2 protein in the cerebellum of Tg+/Pgu increased by 50% compared with Tg/Pgu mice (mean ± S.E., Tg+/Pgu 96.22 ± 6.89, n = 4 versus Tg/Pgu 64.13 ± 7.29, n = 4, p = 0.017). *, p < 0.05; **, p < 0.01; ***, p < 0.001.
FIGURE 8.
FIGURE 8.
Transgenic wild-type Kcna2 cDNA partially rescues the motor incoordination in Pgu mice. A, latency to fall off the accelerating rotarod is shown. Results were averaged over three trials each day for three consecutive days. (supplemental Table 5). Hind-foot missteps on the balance beam (Bi) and latency to traverse the beam (Bii) are shown. (supplemental Table 5). Hind-limb footprint analysis of toe spread (Ci) and stride width and stride length (Cii) are shown. (supplemental Table 6). *, p < 0.05, **, p < 0.01, ***, p < 0.001.

References

    1. Hille B. (2001) Ionic Channels of Excitable Membranes, Sinauer, Sunderland, MA
    1. Trimmer J. S. (1991) Proc. Natl. Acad. Sci. U.S.A. 88, 10764–10768 - PMC - PubMed
    1. Drewe J. A., Verma S., Frech G., Joho R. H. (1992) J. Neurosci. 12, 538–548 - PMC - PubMed
    1. Hwang P. M., Glatt C. E., Bredt D. S., Yellen G., Snyder S. H. (1992) Neuron 8, 473–481 - PubMed
    1. Hwang P. M., Fotuhi M., Bredt D. S., Cunningham A. M., Snyder S. H. (1993) J. Neurosci. 13, 1569–1576 - PMC - PubMed

Publication types

MeSH terms