. 2010 Aug 24;107(34):15246-51.
doi: 10.1073/pnas.1006735107. Epub 2010 Aug 9.

Cortical depth-specific microvascular dilation underlies laminar differences in blood oxygenation level-dependent functional MRI signal

Affiliations

Cortical depth-specific microvascular dilation underlies laminar differences in blood oxygenation level-dependent functional MRI signal

Peifang Tian et al. Proc Natl Acad Sci U S A. .

Abstract

Changes in neuronal activity are accompanied by the release of vasoactive mediators that cause microscopic dilation and constriction of the cerebral microvasculature and are manifested in macroscopic blood oxygenation level-dependent (BOLD) functional MRI (fMRI) signals. We used two-photon microscopy to measure the diameters of single arterioles and capillaries at different depths within the rat primary somatosensory cortex. These measurements were compared with cortical depth-resolved fMRI signal changes. Our microscopic results demonstrate a spatial gradient of dilation onset and peak times consistent with "upstream" propagation of vasodilation toward the cortical surface along the diving arterioles and "downstream" propagation into local capillary beds. The observed BOLD response exhibited the fastest onset in deep layers, and the "initial dip" was most pronounced in layer I. The present results indicate that both the onset of the BOLD response and the initial dip depend on cortical depth and can be explained, at least in part, by the spatial gradient of delays in microvascular dilation, the fastest response being in the deep layers and the most delayed response in the capillary bed of layer I.


Conflict of interest statement

The authors declare no conflict of interest.

Figures
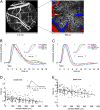
Fig. 1.
Fig. 1.
Relative timing of dilation response along diving trunks. (A) (Left) Image calculated as a maximum intensity projection (MIP) of an image stack 0–300 μm in depth using a 4× objective. Individual images were acquired every 10 μm. (Right) Detailed view of the region within the white square on the left, calculated as a MIP of a stack 0–400 μm in depth acquired with 2-μm resolution. (B) An example of a set of temporal diameter change profiles acquired from an individual arteriolar tree. Each curve is an average of eight stimulus trials. The curves are normalized by the peak amplitude. (C) Population-averaged and peak-normalized time-courses of diameter change for the arteriolar trunks from different cortical depths. Insets in B and C show zoomed-in views of the first 3 s following the stimulus and define color coding. There was no statistically significant change in peak amplitude with depth; the same time-courses without normalization are shown in Fig. S1. (D) Onset time of the arteriolar trunk dilation as a function of the cortical depth. Inset shows an example of fitting a line to the rising slope for the estimation of dilation onset. (E) Time-to-peak of the arteriolar trunk dilation as a function of the cortical depth. In both D and E, the straight line depicts the trend obtained from linear regression fitting. The number of measurements for each category is listed in Table S1.
Fig. 2.
Fig. 2.
Relative timing of dilation as a function of branching order. (A) (Left) MIP of an image stack with a depth of 0–200 μm. The red and blue arrows show the direction of flow in a diving arteriolar tree and in one of the surfacing venules connected to the same capillary bed. (Right) Time-courses of the arteriolar trunk and two first-order branches at different depths are overlaid. Each curve is an average of eight stimulus trials. The curves are normalized by the peak amplitude. (Center) Schematic drawing of branching within the top 200 μm. (B) Population-averaged time-courses of arteriolar trunks and their branches in layer I (<150 μm). (C) Population-averaged time-courses of arteriolar trunks and their branches for layer II/III (150–550 μm). (Inset) The time-courses of higher-order branches from the two depth categories are overlaid. There was no statistically significant change in peak amplitude with depth; the same time-courses without normalization are shown in Fig. S1. (D) Onset time as a function of the cortical depth. (E) Time-to-peak as a function of the cortical depth. In both D and E, the three straight lines (black, magenta, and yellow) depict the trend obtained from linear regression fitting of the trunks, first and higher order branches, respectively.
Fig. 3.
Fig. 3.
Depth-resolved fMRI. (A) (Upper) A raw EPI image of the slice that cuts through the center of evoked activity and a zoomed ROI in the cortex contralateral to the stimulated forepaw (1 mm along the dorsal curvature). The ROI is divided into six 200-μm color-coded slabs. (Lower) The same image as in A thresholded at 40% of the maximum intensity to reflect the sensitivity of the surface RF coil (for display purposes only). (B) BOLD signal time-courses from the same subject using the ROI indicated in A. Color-coded time-courses from different slabs are superimposed. The red arrowheads here and in D and E point to the initial dip. Inset shows a zoomed segment between −2 s and 4 s relative to the stimulus onset. (C) Ratio images of BOLD contrast for the same subject. The images are thresholded as in A. The color scale is expressed as percent signal change relative to the prestimulus baseline. Time (in seconds) relative to stimulus onset is indicated above the images. Note that the upper and lower rows are sampled at different Δt. (D) Time-courses averaged across subjects. For each subject, the time-courses were normalized by the peak of the surface response before averaging. Inset shows timing differences between two slabs corresponding to the top 200 μm (L1) and 600–800 μm (L4). Error bars indicate SE. (E) Time-courses averaged across subjects. Different slabs are normalized by peak amplitude. Error bars shown on the L1 slab (red) and the L4 slab (blue) indicate SE.

References

    1. Devor A, et al. Stimulus-induced changes in blood flow and 2-deoxyglucose uptake dissociate in ipsilateral somatosensory cortex. J Neurosci. 2008;28:14347–14357. - PMC - PubMed
    1. Devor A, et al. Suppressed neuronal activity and concurrent arteriolar vasoconstriction may explain negative blood oxygenation level-dependent signal. J Neurosci. 2007;27:4452–4459. - PMC - PubMed
    1. Peppiatt CM, Howarth C, Mobbs P, Attwell D. Bidirectional control of CNS capillary diameter by pericytes. Nature. 2006;443:700–704. - PMC - PubMed
    1. Stefanovic B, et al. Functional reactivity of cerebral capillaries. J Cereb Blood Flow Metab. 2008;28:961–972. - PMC - PubMed
    1. Brown GG, Perthen JE, Liu TT, Buxton RB. A primer on functional magnetic resonance imaging. Neuropsychol Rev. 2007;17:107–125. - PubMed

Publication types

LinkOut - more resources