

Evidence of intense ongoing endemic transmission of hepatitis C virus in Egypt
- PMID: 20696911
- PMCID: PMC2930444
- DOI: 10.1073/pnas.1008877107
Evidence of intense ongoing endemic transmission of hepatitis C virus in Egypt
Abstract
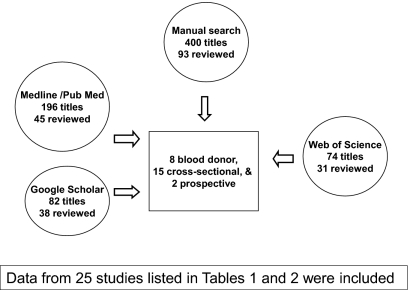
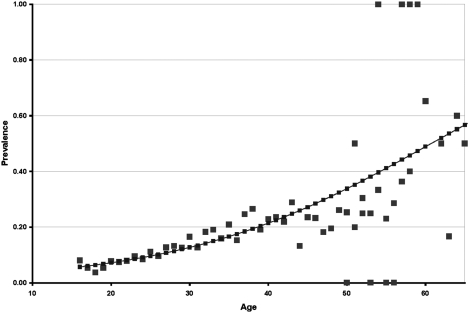
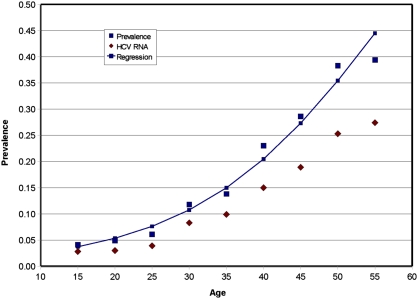
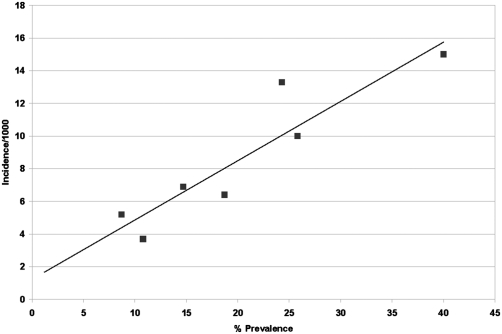
Egypt has the highest prevalence of antibodies to hepatitis C virus (HCV) in the world, estimated nationally at 14.7%. An estimated 9.8% are chronically infected. Numerous HCV prevalence studies in Egypt have published various estimates from different Egyptian communities, suggesting that Egypt, relative to the other nations of the world, might be experiencing intense ongoing HCV transmission. More importantly, a new national study provided an opportunity to apply established epidemiologic models to estimate incidence. Validated mathematical models for estimating incidence from age-specific prevalence were used. All previous prevalence studies of HCV in Egypt were reviewed and used to estimate incidence provided that there was sufficient age-specific data required by the models. All reports of anti-HCV antibody prevalence were much higher than any single other national estimate. Age was the strongest and most consistently associated factor to HCV prevalence and HCV RNA positivity. It was not possible to establish a prior reference point for HCV prevalence or incidence to compare with the 2009 incidence estimates. The modeled incidence from the national study and collectively from the modeled incidence from the previous community studies was 6.9/1,000 [95% confidence interval (CI), 5.5-7.4] per person per year and 6.6/1,000 (95% CI, 5.1-7.0) per person per year, respectively. Projected to the age structure of the Egyptian population, more than 500,000 new HCV infections per year were estimated. Iatrogenic transmission is the most likely, underlining exposure to the ongoing transmission. The study demonstrates the urgency to reduce HCV transmission in Egypt.
Conflict of interest statement
The authors declare no conflict of interest.
Figures
References
-
- Khawaja ZA, Gibney L, Ahmed AJ, Vermund SH. HIV/AIDS and its risk factors in Pakistan. AIDS. 1997;11:843–848. - PubMed
-
- World Bank Group . World Bank Update 2005: HIV/AIDS in Pakistan. Washington, DC: World Bank; 2005.
-
- Yerly S, et al. Nosocomial outbreak of multiple bloodborne viral infections. J Infect Dis. 2001;184:369–372. - PubMed
-
- Abu-Raddad L, et al. Characterizing the HIV/AIDS epidemic in the Middle East and North Africa. Time for Strategic Action. 2010. Middle East and North Africa HIV/AIDS Epidemiology Synthesis Project. World Bank/UNAIDS/WHO Publication.
-
- Laraqui O, et al. Assessing knowledge, attitude, and practice on occupational blood exposure in caregiving facilities, in Morocco (in French) Med Mal Infect. 2008;38:658–666. - PubMed
Publication types
MeSH terms
Substances
LinkOut - more resources
Full Text Sources
Medical
