. 2010 Aug 24;107(34):15063-8.
doi: 10.1073/pnas.1008837107. Epub 2010 Aug 9.

Anisotropy of wave propagation in the heart can be modeled by a Riemannian electrophysiological metric

Affiliations

Anisotropy of wave propagation in the heart can be modeled by a Riemannian electrophysiological metric

Robert J Young et al. Proc Natl Acad Sci U S A. .

Abstract

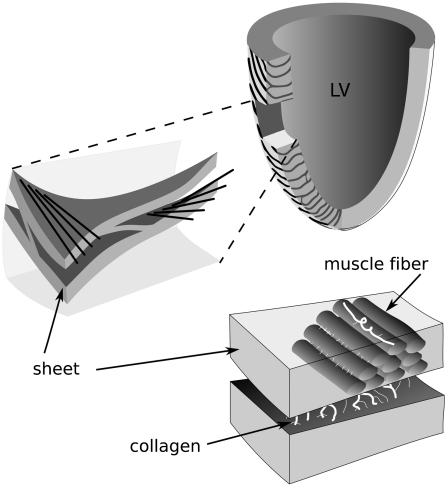
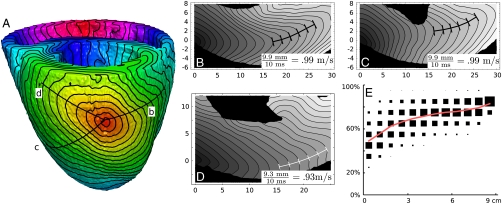
It is well established that wave propagation in the heart is anisotropic and that the ratio of velocities in the three principal directions may be as large as v(f)v(s)v(n) approximately 4(fibers)2(sheets)1(normal). We develop an alternative view of the heart based on this fact by considering it as a non-Euclidean manifold with an electrophysiological(el-) metric based on wave velocity. This metric is more natural than the Euclidean metric for some applications, because el-distances directly encode wave propagation. We develop a model of wave propagation based on this metric; this model ignores higher-order effects like the curvature of wavefronts and the effect of the boundary, but still gives good predictions of local activation times and replicates many of the observed features of isochrones. We characterize this model for the important case of the rotational orthotropic anisotropy seen in cardiac tissue and perform numerical simulations for a slab of cardiac tissue with rotational orthotropic anisotropy and for a model of the ventricles based on diffusion tensor MRI scans of the canine heart. Even though the metric has many slow directions, we show that the rotation of the fibers leads to fast global activation. In the diffusion tensor MRI-based model, with principal velocities 0.25051 m/s, we find examples of wavefronts that eventually reach speeds up to 0.9 m/s and average velocities of 0.7 m/s. We believe that development of this non-Euclidean approach to cardiac anatomy and electrophysiology could become an important tool for the characterization of the normal and abnormal electrophysiological activity of the heart.


Conflict of interest statement

The authors declare no conflict of interest.

Figures

Fig. 1.
Fig. 1.
Fibers and sheets in the ventricles. Schematic representation of cardiac microstructure. [Adapted with permission from ref. 3 (Copyright 1995, Am J Physiol).]
Fig. 2.
Fig. 2.
Isochrones for a wavefront starting from the top surface of a 10 cm × 10 cm × 1.5 cm slab with 180° fiber rotation (α = 1.5 cm, ρ = 180°, vf = 1 m/s, vs = 0.5 m/s, vn = 0.25 m/s). Fibers on the top and bottom surfaces are parallel to the red line, and rotate clockwise from top to bottom. Isochrones are spaced 10 ms apart, and the thick line represents the t = 55 ms isochrone. The intersection of the colored lines marks the stimulation point.
Fig. 3.
Fig. 3.
Alternate views of the same slab. The top four figures show isochrones in slices perpendicular to the slab in Fig. 2. The slices contain the colored lines in Fig.  2. (A)–(D) are slices that are respectively 0° (red line), 45° (blue), 90° (green), and 135° (purple) clockwise from the fiber direction on the top surface. The activation point is the top left corner of each plot, and the contour lines are the same as those in Fig. 2. Note that within a few centimeters, the wavefronts in each direction approach a stationary shape similar to a sine curve. These fronts move at speed vf, as we will see from the bottom figures. The bottom panels (E) graph outward speed along the lines in Fig. 2 with respect to phys-distance from the stimulation point. The red line (A) corresponds to propagation along a fiber, and should be a constant 1 m/s. The initial deviation from 1 m/s is due to numerical inaccuracy and occurs because shortly after stimulation, the ends of the wavefront are highly curved. In all directions, speed starts to increase within 1–2 cm and nears its maximum value of 1 m/s within roughly 4 cm; these distances are comparable to the thickness of the slab.
Fig. 4.
Fig. 4.
Isochrones for a wavefront on the surface of the heart (A) and in three sections through the wall (B)–(D) [marked by lines in (A)]. Isochrones in (A) are spaced 3.75 ms apart; isochrones in (B)–(D) are spaced 2 ms apart. (Isochrones in other slices are given in Fig. S7.) (E) gives a comparison of phys- and el-distance in the model of canine ventricles. The plot is a 2D histogram where data points represent randomly selected pairs of points in the ventricles. The x-coordinate is phys-distance and the y-coordinate is the ratio between the phys-distance and the el-distance. The area of each square is proportional to the number of data points in the corresponding region. To illustrate the change in ratio with increasing distance, the area of the squares in each column is normalized to be the same. The red line represents the mean ratio in each column. Each column represents between n = 59 and n = 4813 pairs of points, for a total of n = 28440 pairs. Selection of pairs is not completely independent; 2844 points were selected at random and for each point, 10 more points were selected at random as its counterparts.

Similar articles

Cited by

References

    1. Winfree AT, Strogatz SH. Organizing centers for three-dimensional chemical waves. Nature. 1984;311:611–615. - PubMed
    1. Mehra R. Global public health problem of sudden cardiac death. J Electrocardiol. 2007;40:S118–S122. - PubMed
    1. LeGrice IJ, et al. Laminar structure of the heart. II. Mathematical model. Am J Physiol. 1995;269:H571–H582. - PubMed
    1. Caldwell BJ, et al. Three distinct directions of intramural activation reveal nonuniform side-to-side electrical coupling of ventricular myocytes. Circ Arrhythm Electrophysiol. 2009;2(4):433–440. - PubMed
    1. Wellner M, Berenfeld O, Jalife J, Pertsov AM. Minimal principle for rotor filaments. Proc Natl Acad Sci USA. 2002;99:8015–8018. - PMC - PubMed

Publication types

LinkOut - more resources