. 2010 Sep;120(9):3350-64.
doi: 10.1172/JCI41080. Epub 2010 Aug 9.

Myeloid mineralocorticoid receptor controls macrophage polarization and cardiovascular hypertrophy and remodeling in mice

Affiliations

Myeloid mineralocorticoid receptor controls macrophage polarization and cardiovascular hypertrophy and remodeling in mice

Michael G Usher et al. J Clin Invest. 2010 Sep.

Abstract

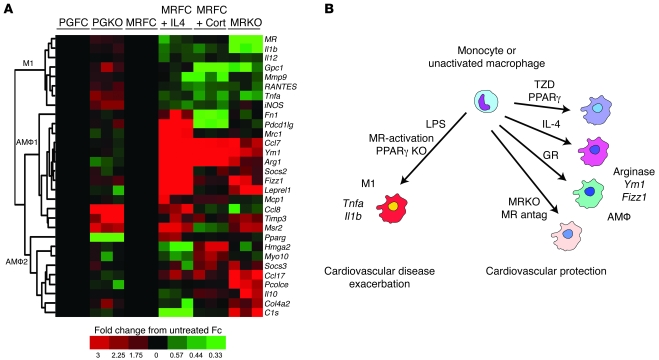
Inappropriate excess of the steroid hormone aldosterone, which is a mineralocorticoid receptor (MR) agonist, is associated with increased inflammation and risk of cardiovascular disease. MR antagonists are cardioprotective and antiinflammatory in vivo, and evidence suggests that they mediate these effects in part by aldosterone-independent mechanisms. Here we have shown that MR on myeloid cells is necessary for efficient classical macrophage activation by proinflammatory cytokines. Macrophages from mice lacking MR in myeloid cells (referred to herein as MyMRKO mice) exhibited a transcription profile of alternative activation. In vitro, MR deficiency synergized with inducers of alternatively activated macrophages (for example, IL-4 and agonists of PPARgamma and the glucocorticoid receptor) to enhance alternative activation. In vivo, MR deficiency in macrophages mimicked the effects of MR antagonists and protected against cardiac hypertrophy, fibrosis, and vascular damage caused by L-NAME/Ang II. Increased blood pressure and heart rates and decreased circadian variation were observed during treatment of MyMRKO mice with L-NAME/Ang II. We conclude that myeloid MR is an important control point in macrophage polarization and that the function of MR on myeloid cells likely represents a conserved ancestral MR function that is integrated in a transcriptional network with PPARgamma and glucocorticoid receptor. Furthermore, myeloid MR is critical for blood pressure control and for hypertrophic and fibrotic responses in the mouse heart and aorta.


Figures

Figure 1
Figure 1. MR controls macrophage polarization.
We studied the in vitro effects of MR agonists and antagonists in cultured PEMs. (A) Stimulation of TNF-α expression by aldosterone (Aldo; 10 nM) in steroid-depleted serum is abolished by MR but not GR antagonist. The dose response of Tnfa expression to different concentrations of aldosterone in steroid-depleted medium shows a high-affinity response consistent with MR. (B) Aldosterone (10 nM) causes increases in M1 classically activated proinflammatory genes in steroid-depleted medium. (C) Aldosterone (10 nM) increases the Tnfa response to LPS in steroid-depleted medium that is blocked by eplerenone (Epl; 5 μM). (D) In normal serum (10% FBS), the MR antagonist spironolactone (Spiro; 5 μM for 24 hours) decreases proinflammatory gene expression. (E) Corticosterone increases Tnfa expression in steroid-depleted medium that is blocked by the GR antagonist RU486 (5 μM) but not eplerenone (5 μM). (F) Twenty-four hours of 1 μM RU26752, a specific MR antagonist, increases AMϕ marker expression. (G) The MR antagonist RU26752 (1 μM) increases some antifibrotic (Htra1, a TGF-β inhibitor) and cardioprotective (e.g., Adm) genes and decreases some profibrotic genes (e.g., Pai1). #P < 0.03, P < 0.038, P < 0.034, §P < 0.025, Benjamini-Hochberg correction; *P < 0.05, **P < 0.01, ***P < 0.001 by 2-way ANOVA with Bonferroni post-tests.
Figure 2
Figure 2. MyMRKO causes alteration similar to that of MR antagonists in macrophages.
PEMs were isolate from littermate FC or MyMRKO mice. (A) PEMs isolated from MyMRKO (MRKO) compared with FC mice show increased expression of AMϕ markers and decreased M1 markers. (B) Differences in expression of genes associated with fibrosis. (C) MyMRKO or MR antagonist (1 μM RU26752) alteration of LPS response. (D) Increases in AMϕ markers with IL-4 stimulation. #P < 0.035, P < 0.031, Benjamini-Hochberg correction; *P < 0.05, **P < 0.01 by 2-tailed Student’s t test for multiple gene comparisons corrected for false discovery rate or 2-way ANOVA with Bonferroni post-tests.
Figure 3
Figure 3. MyMRKO protects against L-NAME/Ang II–induced cardiac hypertrophy and fibrosis.
(A) Heart weight to body weight ratios and gene expression of markers of cardiac hypertrophy in FC and MyMRKO mice with or without (–) L-NAME/Ang II treatment (see Methods). (B) Representative H&E and picrosirius red staining of cross sections of heart samples. Fibrotic tissues stained red. Scale bar: 100 μm. (C) Quantification of interstitial fibrotic areas. (D) Gene expression of markers of cardiac fibrosis. *P < 0.05, **P < 0.01, ***P < 0.001 by 2-way ANOVA Bonferroni post-tests.
Figure 4
Figure 4. MyMRKO reduces L-NAME/Ang II–induced interstitial macrophage recruitment in heart.
(A) Representative immunofluorescence assay of cross sections of heart samples from FC and MyMRKO mice with or without L-NAME/Ang II treatment. Mac2 antibody was used to detect macrophages. Scale bar: 100 μm. BF, bright field. (B) Quantification of interstitial macrophages stained by Mac2. The results are expressed as macrophage counts per high-power field (×400) under microscope. (C) Gene expression of macrophage marker F4/80. (D) Gene expression of M1 markers (Tnfa and RANTES) and AMF markers (Fizz1 and F13a1). *P < 0.05, **P < 0.01, ***P < 0.001 by 2-way ANOVA Bonferroni post-tests.
Figure 5
Figure 5. MyMRKO reduces perivascular fibrosis and macrophage recruitment induced by L-NAME/Ang II in heart.
(A) Representative picrosirius red staining and immunofluorescence assay of cross sections of heart samples from FC and MyMRKO mice with or without L-NAME/Ang II treatment. Fibrotic tissues stained red. Mac2 antibody was used to detect macrophages. Scale bar: 100 μm. (B) Quantification of perivascular fibrotic areas. (C) Quantification of perivascular macrophages stained by Mac2. The results are expressed as macrophage counts per high-power field (×400) under microscope. ***P < 0.001 by 2-way ANOVA Bonferroni post-tests.
Figure 6
Figure 6. MyMRKO protects against L-NAME/Ang II–induced aortic fibrosis and hypertrophy.
(A) Representative picrosirius red staining of cross sections of aortas from FC and MyMRKO mice with or without L-NAME/Ang II treatment. Fibrotic tissues stained red. Scale bar: 100 μm. (B) Quantification of aortic fibrotic areas. (C) Gene expression of markers of cardiac fibrosis. (D) Quantification of aortic hypertrophy. **P < 0.01, ***P < 0.001 by 2-way ANOVA Bonferroni post-tests.
Figure 7
Figure 7. MyMRKO reduces L-NAME/Ang II–induced aortic macrophage recruitment.
(A) Representative immunofluorescence assay of cross sections of aortas from FC and MyMRKO mice with or without L-NAME/Ang II treatment. Mac2 antibody was used to detect macrophages. Scale bar: 100 μm. (B) Quantification of aortic macrophages stained by Mac2. The results are expressed as macrophage counts per high-power field (×400) under microscope. (C) Gene expression of macrophage marker F4/80. (D) Gene expression of M1 marker Tnfa and AMϕ marker Arg1. ***P < 0.001 by 2-way ANOVA Bonferroni post-tests.
Figure 8
Figure 8. MyMRKO causes an increased blood pressure and heart rate response to L-NAME/Ang II.
Twenty-four-hour averages of blood pressure and heart rate data collected by radiotelemetry under each condition of the model show a significant increase in daytime systolic pressure, pulse pressure, and heart rate in MyMRKO versus FC mice.
Figure 9
Figure 9. MR opposes PPARγ in macrophage polarization.
(A) Hierarchical clustering of M1 and AMϕ marker gene expression measured by real-time PCR from primary peritoneal macrophages demonstrates significant overlap between PPARγ activation and MyMRKO. (B) Deletion of MR enhanced the AMϕ-polarizing effects of 10 μM pioglitazone (Pio). (C) MyPGKO macrophages cultured in C/D medium showed increases in M1 markers that were enhanced by addition of 10 nM aldosterone. (D) MyMRKO and MyPGKO respectively enhance and oppose IL-4 stimulation of the AMϕ marker Ccl7. MRFC, FC for MyMRKO; PGFC, FC for MyPGKO; PGKO, MyPGKO; Cort, corticosterone. *P < 0.05, **P < 0.01, ***P < 0.001 by 2-way ANOVA Bonferroni post-tests.
Figure 10
Figure 10. MR cooperates with glucocorticoid signaling in macrophages.
(A) Affymetrix analysis of peritoneal macrophages treated with 1 μM corticosterone for 24 hours shows a minority of genes regulated by MR and GR activation. (B) MyMRKO can enhance the induction of AMϕ by corticosterone (cluster A), mimic the repression of proinflammatory factors by corticosterone (cluster B), or have the same effect as corticosterone but an not an additional effect with combination (cluster C). Representative genes are listed to the right of each cluster. (C) MyMRKO synergized with corticosterone to induce genes important in AMϕ macrophage polarization (Ym1 and F13a1) and enhance the TGF-β inhibitor Htra1 and thrombin inhibitor Serpine2. (D) MyMRKO synergized with corticosterone to repress TGF-β target E-cadherin (Cdh1) and IL-27 receptor. In addition, MyMRKO abolished additional repression of Il1b and the proinflammatory C-type lectin Clec2 by corticosterone. *P < 0.05, **P < 0.01, ***P < 0.001 by 2-way ANOVA Bonferroni post-tests.
Figure 11
Figure 11. Nuclear receptor network regulating macrophage polarization.
(A) Heatmap of hierarchical cluster analysis of gene expression altered by MyPGKO, IL-4, MyMRKO, and corticosterone treatment in macrophages. Nuclear receptor activation or inactivation can dramatically alter the expression patterns of genes associated with macrophage polarization. Classical activation markers (M1) are segregated from AMϕ-associated genes. There are two major subtypes of AMϕ gene patterns: one where the expression in the different treatments is concordant (AMϕ1); and one where there are a number of genes where there are substantial differences (AMϕ2). (B) Summary of macrophage activation and cardiovascular consequences.

References

    1. Pitt B, et al. The effect of spironolactone on morbidity and mortality in patients with severe heart failure. Randomized aldactone evaluation study investigators. N Engl J Med. 1999;341(10):709–717. doi: 10.1056/NEJM199909023411001. - DOI - PubMed
    1. Pitt B, et al. The EPHESUS trial: eplerenone in patients with heart failure due to systolic dysfunction complicating acute myocardial infarction. Eplerenone post-AMI heart failure efficacy and survival study. Cardiovasc Drugs Ther. 2001;15(1):79–87. doi: 10.1023/A:1011119003788. - DOI - PubMed
    1. Guo C, et al. Mineralocorticoid receptor antagonist reduces renal injury in rodent models of types 1 and 2 diabetes mellitus. Endocrinology. 2006;147(11):5363–5373. doi: 10.1210/en.2006-0944. - DOI - PubMed
    1. Lam EY, Funder JW, Nikolic-Paterson DJ, Fuller PJ, Young MJ. Mineralocorticoid receptor blockade but not steroid withdrawal reverses renal fibrosis in deoxycorticosterone/salt rats. Endocrinology. 2006;147(7):3623–3629. doi: 10.1210/en.2005-1527. - DOI - PubMed
    1. Rajagopalan S, Duquaine D, King S, Pitt B, Patel P. Mineralocorticoid receptor antagonism in experimental atherosclerosis. Circulation. 2002;105(18):2212–2216. doi: 10.1161/01.CIR.0000015854.60710.10. - DOI - PubMed

Publication types

MeSH terms

Associated data