. 2011 Jan;91(1):63-84.
doi: 10.1038/labinvest.2010.151. Epub 2010 Aug 9.

Cytokines induce small intestine and liver injury after renal ischemia or nephrectomy

Affiliations

Cytokines induce small intestine and liver injury after renal ischemia or nephrectomy

Sang Won Park et al. Lab Invest. 2011 Jan.

Abstract

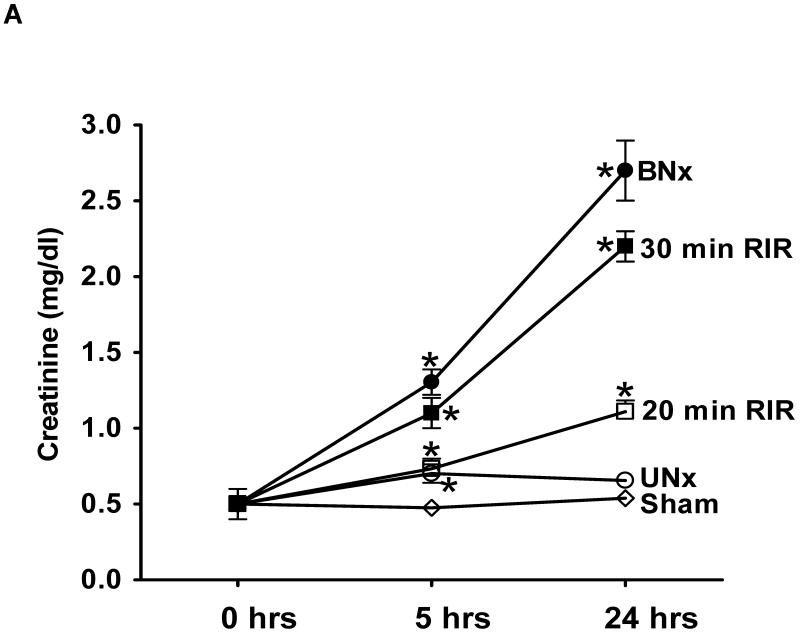
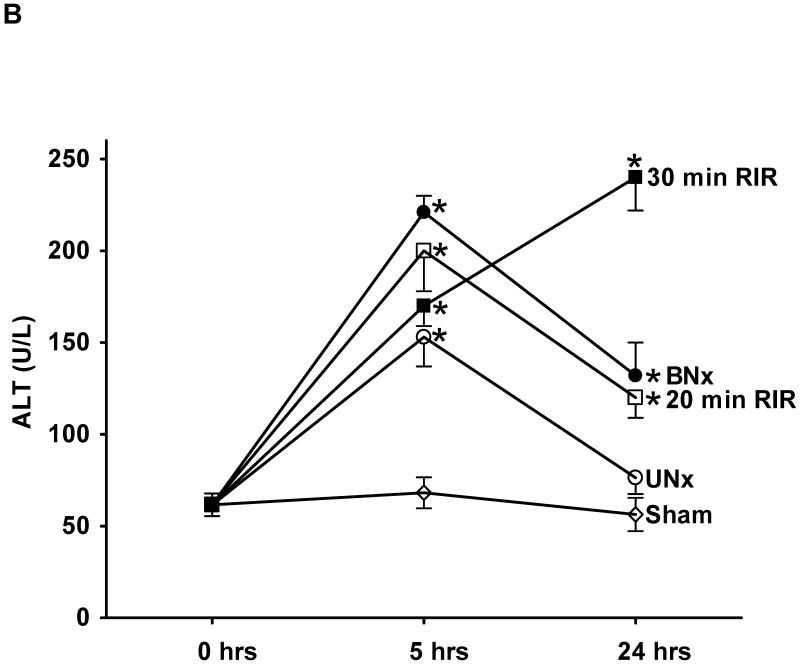
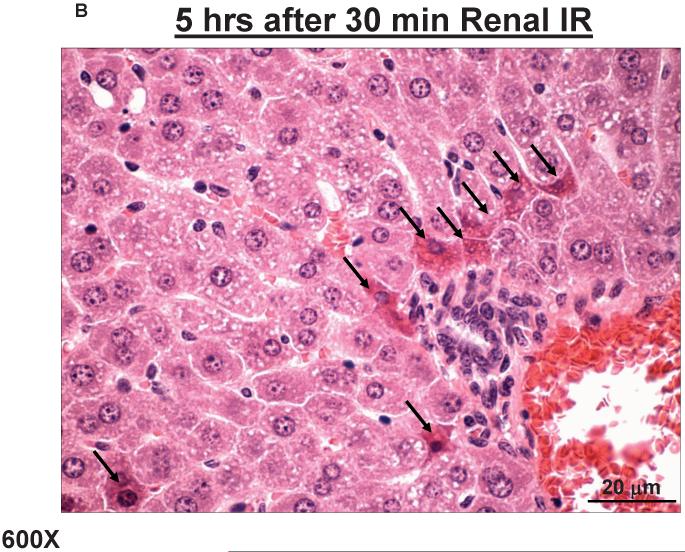
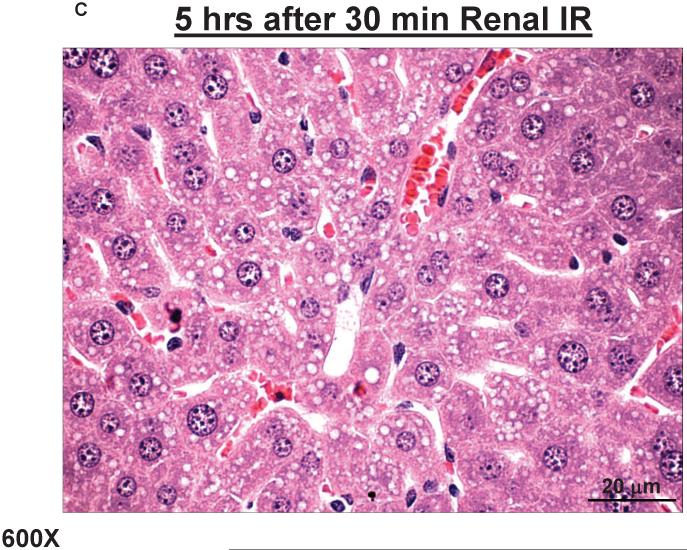
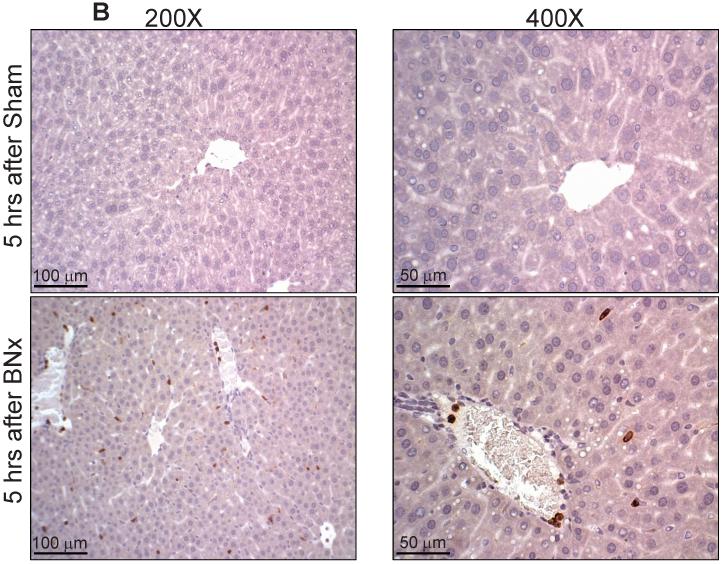
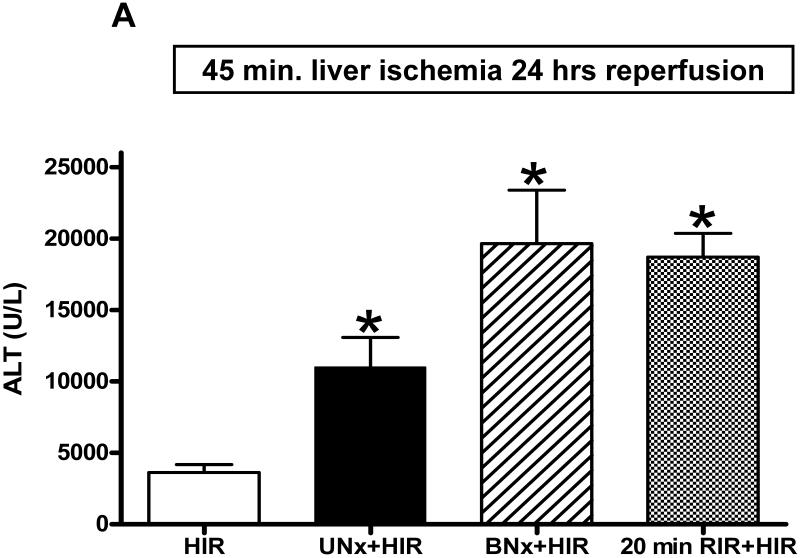
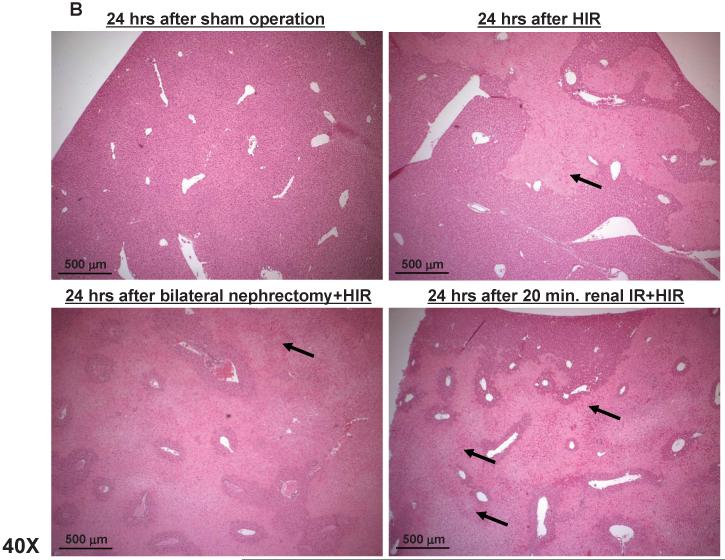
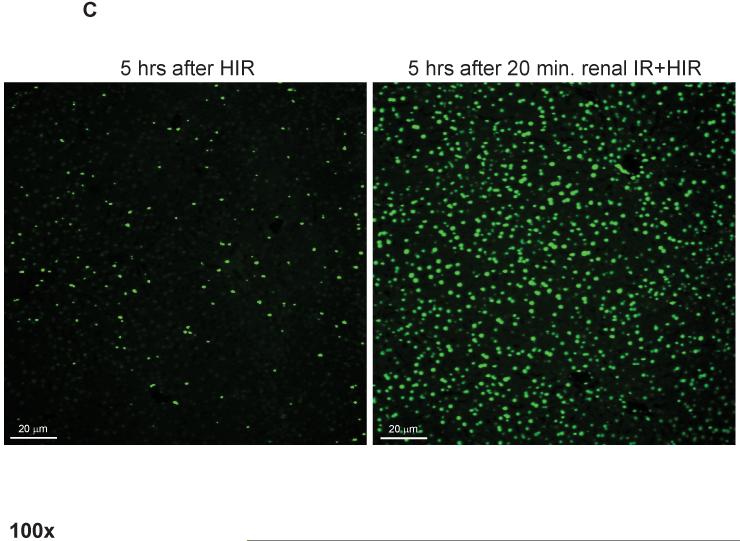
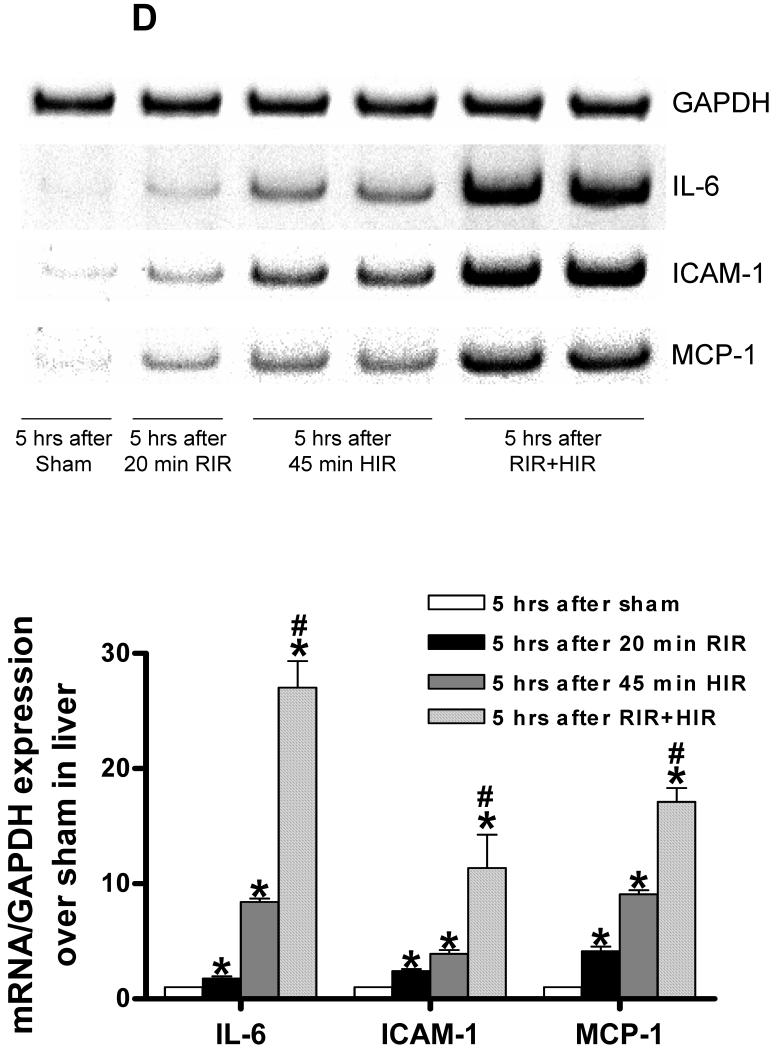
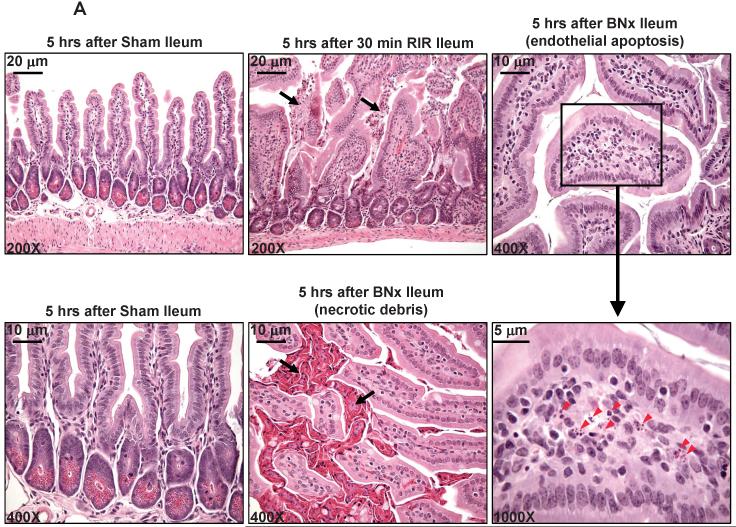
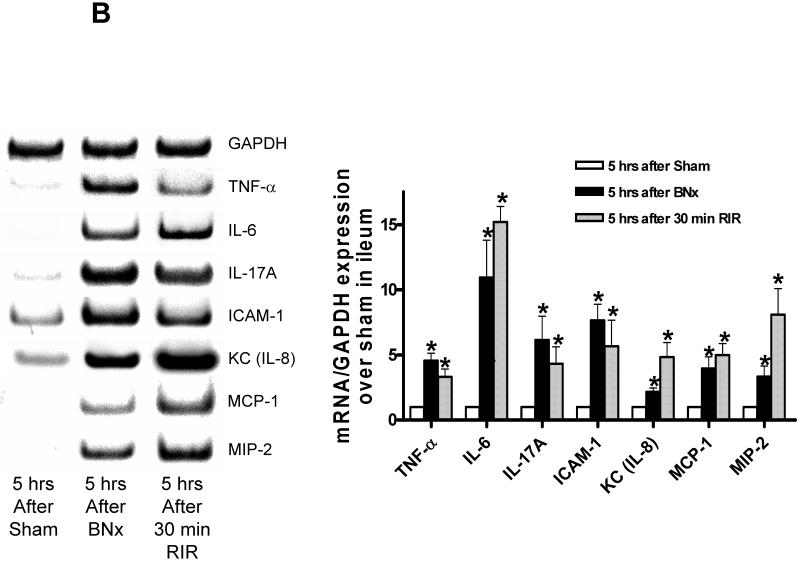
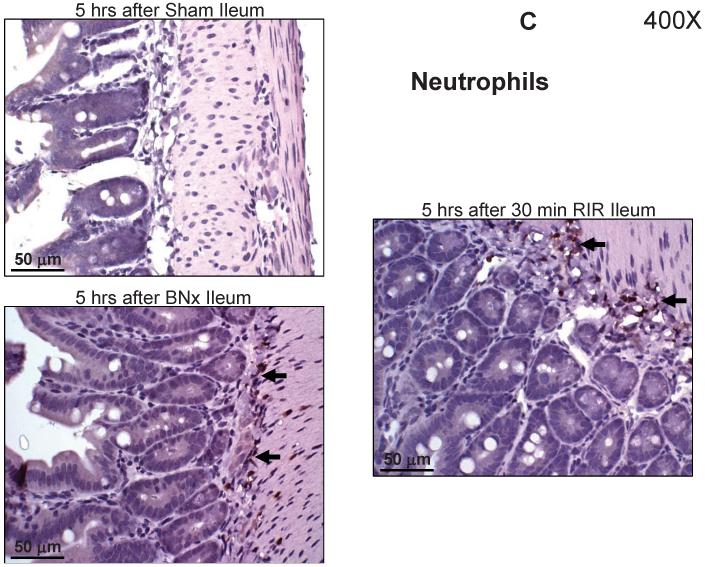
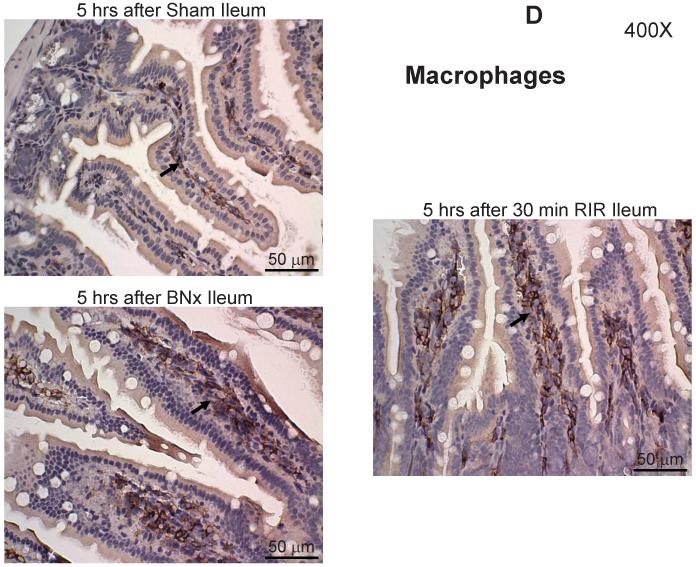
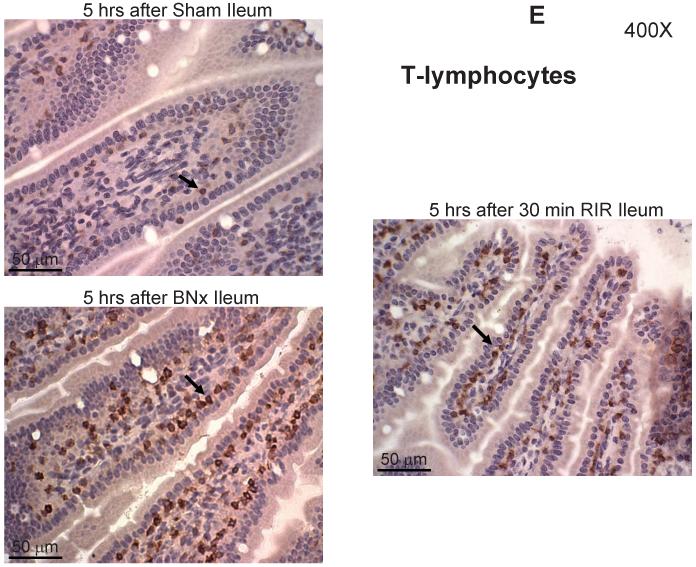
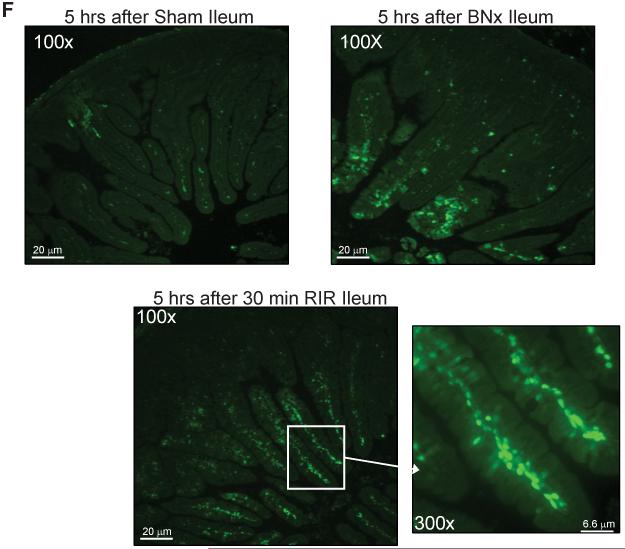
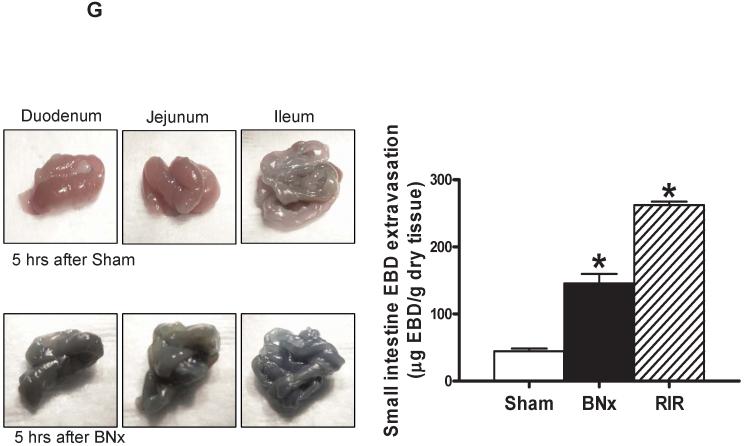
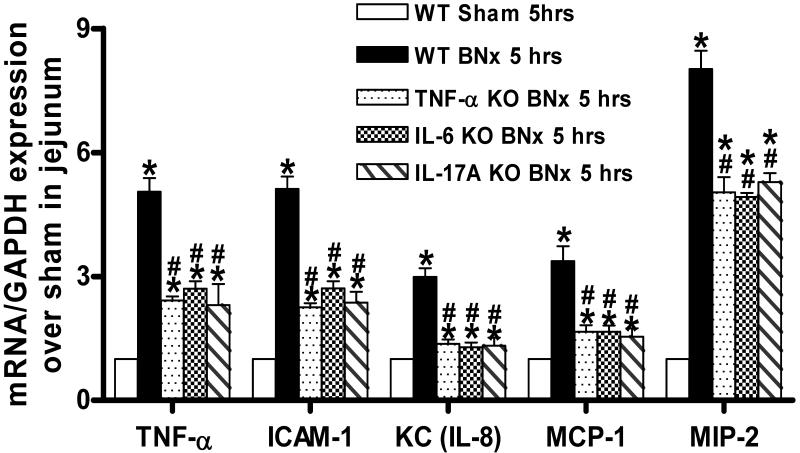
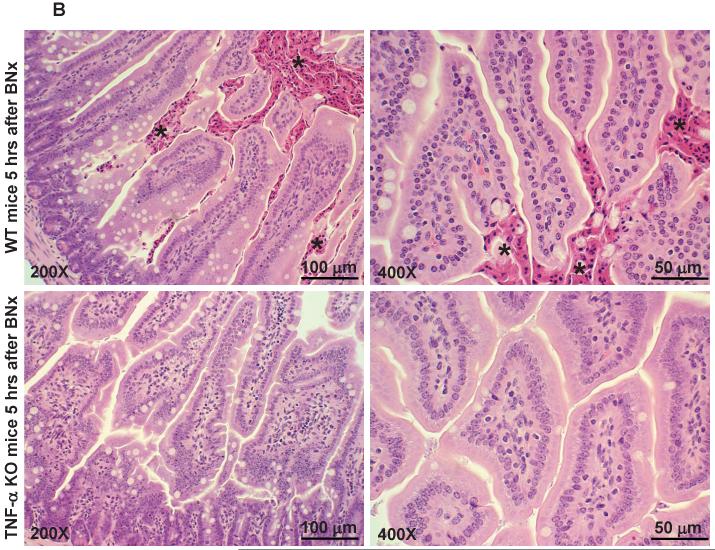
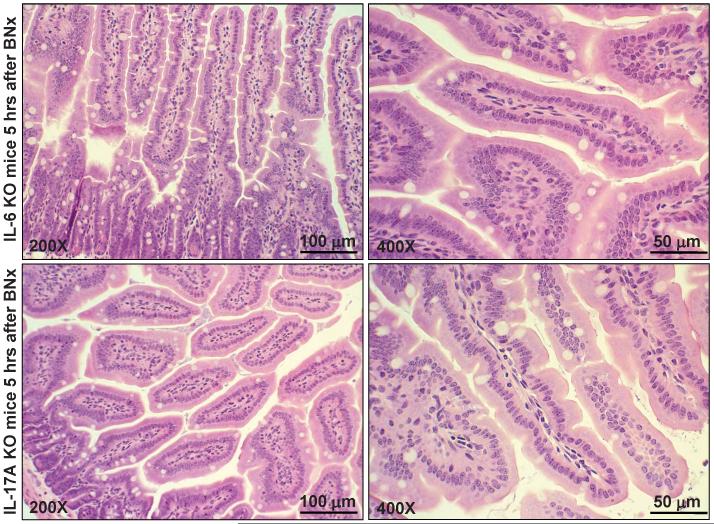
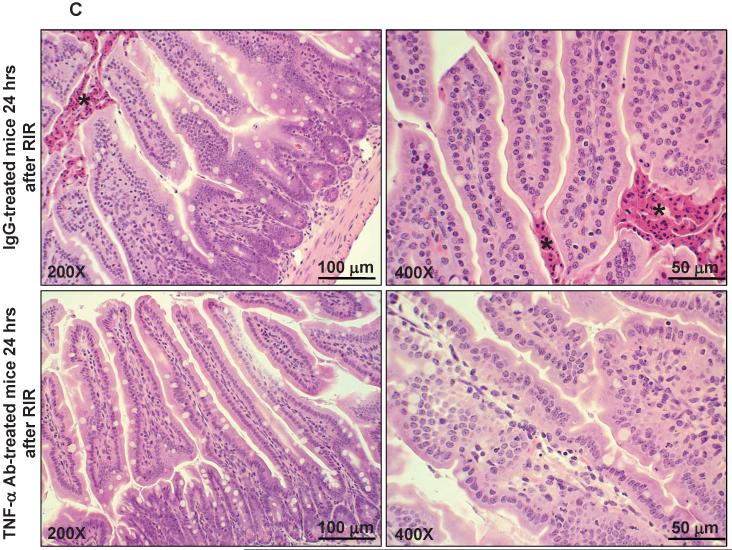
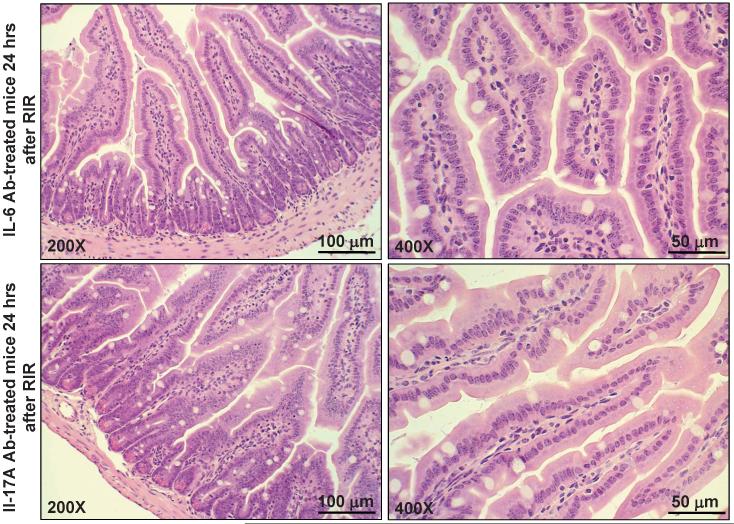
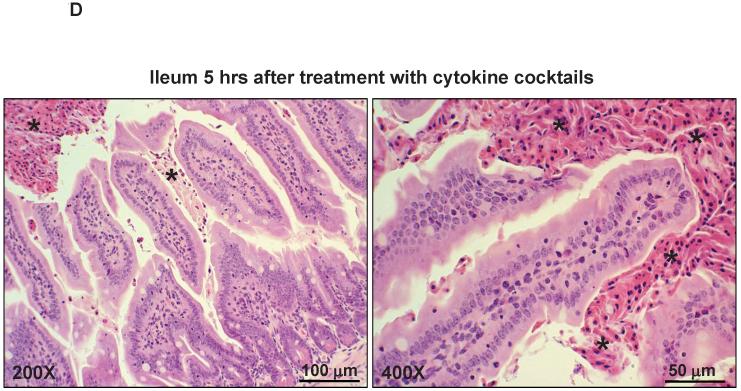
Patients with acute kidney injury (AKI) frequently suffer from extra-renal complications including hepatic dysfunction and systemic inflammation. We aimed to determine the mechanisms of AKI-induced hepatic dysfunction and systemic inflammation. Mice subjected to AKI (renal ischemia reperfusion (IR) or nephrectomy) rapidly developed acute hepatic dysfunction and suffered significantly worse hepatic IR injury. After AKI, rapid peri-portal hepatocyte necrosis, vacuolization, neutrophil infiltration and pro-inflammatory mRNA upregulation were observed suggesting an intestinal source of hepatic injury. Small intestine histology after AKI showed profound villous lacteal capillary endothelial apoptosis, disruption of vascular permeability and epithelial necrosis. After ischemic or non-ischemic AKI, plasma TNF-α, IL-17A and IL-6 increased significantly. Small intestine appears to be the source of IL-17A, as IL-17A levels were higher in the portal circulation and small intestine compared with the levels measured from the systemic circulation and liver. Wild-type mice treated with neutralizing antibodies against TNF-α, IL-17A or IL-6 or mice deficient in TNF-α, IL-17A, IL-17A receptor or IL-6 were protected against hepatic and small intestine injury because of ischemic or non-ischemic AKI. For the first time, we implicate the increased release of IL-17A from small intestine together with induction of TNF-α and IL-6 as a cause of small intestine and liver injury after ischemic or non-ischemic AKI. Modulation of the inflammatory response and cytokine release in the small intestine after AKI may have important therapeutic implications in reducing complications arising from AKI.


Figures

Figure 1
Figure 1. Acute renal and hepatic dysfunction after ischemic or non-ischemic AKI
Plasma creatinine (A), alanine aminotransferase (B) and bilirubin (C) levels after ischemic (renal IR) or non-ischemic (nephrectomy) AKI induction in mice. Mice were subjected to sham-operation (Sham, N=4), unilateral nephrectomy (UNx, N=6-8), bilateral nephrectomy (BNx, N=6-8), 20 min. renal IR (RIR, N=8) or 30 min. renal IR (N=8). *P<0.05 vs. sham-operated mice. Data presented as mean ± SEM.
Figure 2
Figure 2. Acute hepatic injury with increased hepatic necrosis and vacuolization after ischemic AKI
Representative photomicrographs of liver from 6 experiments (hematoxylin and eosin staining, magnification 600X) of mice subjected to sham-operation (Sham) or to 30 min. renal ischemia and 5 hrs of reperfusion (30 min. renal IR). Sham operated animals show normal-appearing hepatocyte parenchyma (A). Five hours after 30 min. renal IR (B, C), nuclear and cytoplasmic degenerative changes, centrilobular necrosis (B, arrows), marked hepatocyte vacuolization (C) and congestion were observed.
Figure 3
Figure 3. Increased hepatic inflammation after ischemic or non-ischemic AKI
A. Representative gel images and band intensity quantifications of semi-quantitative RT-PCR of the pro-inflammatory markers ICAM-1, TNF-α, IL-6, IL-17A, KC, MCP-1 and MIP-2 from liver tissues of mice subjected to sham-operation (Sham), bilateral nephrectomy (BNx) or 30 min. renal IR (RIR). Liver tissues were harvested 5 hrs after sham-operation or AKI induction. *P<0.05 vs. sham-operated mice. Error bars represent 1 SEM. B. Representative photomicrographs (200X and 400X) of 4 experiments of immunohistochemistry for neutrophil infiltration (dark brown stain) in the liver tissues harvested from mice subjected to sham-operation (Sham) or to bilateral nephrectomy (BNx) 5 hrs prior.
Figure 4
Figure 4. Increased hepatic vascular permeability after ischemic or non-ischemic AKI
(Left) Representative photographs of liver isolated from mice subjected to sham-operation or to bilateral nephrectomy (BNx) 5 hrs prior and injected with Evans blue dye (EBD). (Right) Quantification of liver EBD extravasations in mice subjected to sham-operation (N=6), bilateral nephrectomy (BNx) or 30 min. renal IR (RIR). Five hrs after surgery, EBD was extracted in formamide and the amount of extravasated EBD in the liver was calculated against a standard curve. *P<0.05 vs. sham-operated mice. Error bars represent 1 SEM.
Figure 5
Figure 5. Exacerbated hepatic IR injury (necrosis, apoptosis and inflammation) after ischemic or non-ischemic AKI
A. Plasma alanine aminotransferase (ALT) levels in mice subjected to sham-operation (Sham, N=4), 45 min. hepatic ischemia and reperfusion (HIR, N=6), HIR coupled with unilateral nephrectomy (UNx+HIR, N=6), HIR coupled with bilateral nephrectomy (BNx+HIR, N=6) or HIR coupled with 20 min. renal ischemia and reperfusion (RIR+HIR, N=8) 24 hrs prior. *P<0.05 vs. HIR mice. Error bars represent 1 SEM. B. Representative hematoxylin and eosin staining photomicrographs in liver sections (magnification X40) in mice subjected to sham-operation, 45 min. hepatic ischemia and reperfusion (HIR), HIR coupled with bilateral nephrectomy or HIR coupled with 20 min. renal ischemia and reperfusion 24 hrs prior. Necrotic hepatic tissue appears as light pink. Arrows indicate vascular congestion and inflammation. C. Representative fluorescence photomicrographs (of 4 experiments) of liver sections illustrating apoptotic nuclei [terminal deoxynucleotidyl transferase biotin-dUTP nick end-labeling (TUNEL) fluorescence staining, 100X] from mice subjected to 45 min. hepatic ischemia and reperfusion (HIR) or HIR coupled with 20 min. renal ischemia and reperfusion 24 hrs prior. D. Representative gel images (top) and band intensity quantifications (bottom) of semi-quantitative RT-PCR of the pro-inflammatory markers ICAM-1, IL-6 and MCP-1 from liver tissues of mice subjected to sham-operation (Sham), 20 min. renal ischemia and reperfusion (RIR), 45 min hepatic ischemia and reperfusion (HIR) or 20 min RIR plus HIR. Liver tissues were harvested 5 hrs after sham-operation or AKI induction. *P<0.05 vs. sham-operated mice. Error bars represent 1 SEM. #P<0.01 vs. HIR mice.
Figure 6
Figure 6. Increased small intestine necrosis, apoptosis and inflammation after ischemic or non-ischemic AKI
A. Representative photomicrographs of ileum from 5 experiments (hematoxylin and eosin staining, magnification 200X and 400X) of mice subjected to sham-operation (Sham), to 30 min. renal ischemia and 5 hrs of reperfusion (RIR) or to bilateral nephrectomy (BNx). Sham operated animals show normal-appearing intestine histology (left panel). As shown in middle upper panel, lower power images (200X) show full thickness of the ileal wall and villi that appear thickened, blunted and inflamed compared to sham. In addition, 5 hours after 30 min. renal IR or bilateral nephrectomy, severe intestine epithelial cell necrosis of villous lining cells and the development of a necrotic epithelial pannus (arrows) over the mucosal surface were observed (middle panel). Finally, we observed prominent capillary endothelial apoptosis within the central villi of ileum (right panel). Enlarged insert shows several apoptotic endothelial cells (red arrow heads) within a villus. B. Representative gel images and band intensity quantifications of semi-quantitative RT-PCR of the pro-inflammatory markers ICAM-1, TNF-α, IL-6, IL-17A, KC, MCP-1 and MIP-2 from ileum of mice subjected to sham-operation (Sham), bilateral nephrectomy (BNx) or 30 min. renal IR (RIR). Tissues were harvested 5 hrs after sham-operation or AKI induction. *P<0.05 vs. sham-operated mice. Error bars represent 1 SEM. C-E. Representative photomicrographs (400X, dark brown stain indicated by arrows) of 5 experiments of immunohistochemistry for neutrophils (C), macrophages (D) and T-lymphocytes (E) in the small intestine tissues harvested from mice subjected to sham-operation (Sham), bilateral nephrectomy (BNx) or 30 min. renal IR (RIR) 5 hrs prior. F. Representative fluorescence photomicrographs (of 5 experiments) of ileum sections illustrating apoptotic nuclei [terminal deoxynucleotidyl transferase biotin-dUTP nick end-labeling (TUNEL) fluorescence staining, 100X]. Mice were subjected to sham-operation, bilateral nephrectomy (BNx) or 30 min. renal ischemia reperfusion (RIR) 5 hrs prior. Enlarged insert (of ileum from mice subjected to 30 min. RIR) shows prominent capillary endothelial apoptosis. G. (Left) Representative photographs of small intestine tissues (duodenum, jejunum and ileum) isolated from mice subjected to sham-operation or to bilateral nephrectomy (BNx) 5 hrs prior and injected with Evans blue dye (EBD). (Right) Quantification of small intestine EBD extravasations in mice subjected to sham-operation (N=6), bilateral nephrectomy (BNx) or 30 min. renal IR (RIR). Five hrs after surgery, EBD was extracted in formamide and the amount of extravasated EBD in the intestine was calculated against a standard curve. *P<0.05 vs. sham-operated mice. Error bars represent 1 SEM.
Figure 7
Figure 7
A. Representative gel images (top) and band intensity quantifications (bottom) of semi-quantitative RT-PCR of the pro-inflammatory markers ICAM-1, TNF-α, IL-6, KC, MCP-1 and MIP-2 from ileum of C57BL/6 (WT) mice subjected to sham-operation (Sham) or bilateral nephrectomy (BNx) compared to pro-inflammatory gene expression from the ileum of TNF-α, IL-6 or IL-17A deficient (KO) mice. Tissues were harvested 5 hrs after sham-operation or AKI induction. *P<0.05 vs. sham-operated mice. #P<0.05 vs. WT mice subjected to BNx. Error bars represent 1 SEM. B-D. Representative photomicrographs of ileum of hematoxylin and eosin staining (magnification 200X and 400X) of WT, TNF-α, IL-6 or IL-17A KO mice subjected to BNx 5 hrs prior (B), WT mice treated with isotype control IgG, TNF-α, IL-6 or IL-17A neutralizing antibody (Ab) and subjected to RIR 24 hrs prior (C) and WT mice treated with a combination of recombinant mouse TNF-α, IL-6 plus IL-17A in lieu of AKI 5 hrs prior (D). Cytokine deficient mice or WT mice treated with cytokine neutralizing antibodies (single antibody)were protected against small intestine injury whereas WT mice treated with cytokine cocktails demonstrate severe injury (*). Representative of 4 experiments.
Figure 7
Figure 7
A. Representative gel images (top) and band intensity quantifications (bottom) of semi-quantitative RT-PCR of the pro-inflammatory markers ICAM-1, TNF-α, IL-6, KC, MCP-1 and MIP-2 from ileum of C57BL/6 (WT) mice subjected to sham-operation (Sham) or bilateral nephrectomy (BNx) compared to pro-inflammatory gene expression from the ileum of TNF-α, IL-6 or IL-17A deficient (KO) mice. Tissues were harvested 5 hrs after sham-operation or AKI induction. *P<0.05 vs. sham-operated mice. #P<0.05 vs. WT mice subjected to BNx. Error bars represent 1 SEM. B-D. Representative photomicrographs of ileum of hematoxylin and eosin staining (magnification 200X and 400X) of WT, TNF-α, IL-6 or IL-17A KO mice subjected to BNx 5 hrs prior (B), WT mice treated with isotype control IgG, TNF-α, IL-6 or IL-17A neutralizing antibody (Ab) and subjected to RIR 24 hrs prior (C) and WT mice treated with a combination of recombinant mouse TNF-α, IL-6 plus IL-17A in lieu of AKI 5 hrs prior (D). Cytokine deficient mice or WT mice treated with cytokine neutralizing antibodies (single antibody)were protected against small intestine injury whereas WT mice treated with cytokine cocktails demonstrate severe injury (*). Representative of 4 experiments.
Figure 8
Figure 8. Proposed mechanisms of acute kidney injury induced liver dysfunction and systemic inflammation
Acute kidney injury causes small intestinal generation of IL-17A and subsequent intestinal injury (villous endothelial apoptosis, epithelial necrosis, increased pro-inflammatory cell translocation and cytokine flux to the liver). These events cause hepatic injury (inflammation, apoptosis and necrosis) with increased generation and release of TNF-α and IL-6 systemically causing further multi-organ injury and systemic inflammation.

References

    1. Jones DR, Lee HT. Perioperative renal protection. Best Pract Res Clin Anaesthesiol. 2008;22:193–208. - PubMed
    1. Bove T, Calabro MG, Landoni G, Aletti G, Marino G, Crescenzi G, Rosica C, Zangrillo A. The incidence and risk of acute renal failure after cardiac surgery. J Cardiothorac Vasc Anesth. 2004;18:442–445. - PubMed
    1. Elapavaluru S, Kellum JA. Why do patients die of acute kidney injury? Acta Clin Belg Suppl. 2007:326–331. - PubMed
    1. Paladino JD, Hotchkiss JR, Rabb H. Acute kidney injury and lung dysfunction: a paradigm for remote organ effects of kidney disease? Microvasc Res. 2009;77:8–12. - PMC - PubMed
    1. Grigoryev DN, Liu M, Hassoun HT, Cheadle C, Barnes KC, Rabb H. The local and systemic inflammatory transcriptome after acute kidney injury. J Am Soc Nephrol. 2008;19:547–558. - PMC - PubMed

Publication types

MeSH terms