. 2010 Aug 11;10(8):3179-83.
doi: 10.1021/nl1020975.

Frequency domain detection of biomolecules using silicon nanowire biosensors

Affiliations

Frequency domain detection of biomolecules using silicon nanowire biosensors

Gengfeng Zheng et al. Nano Lett. .

Abstract

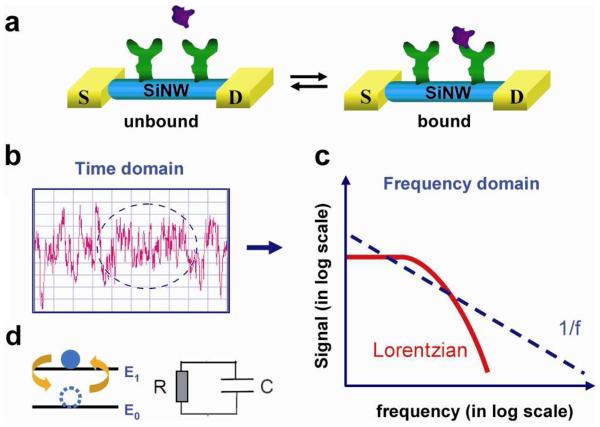
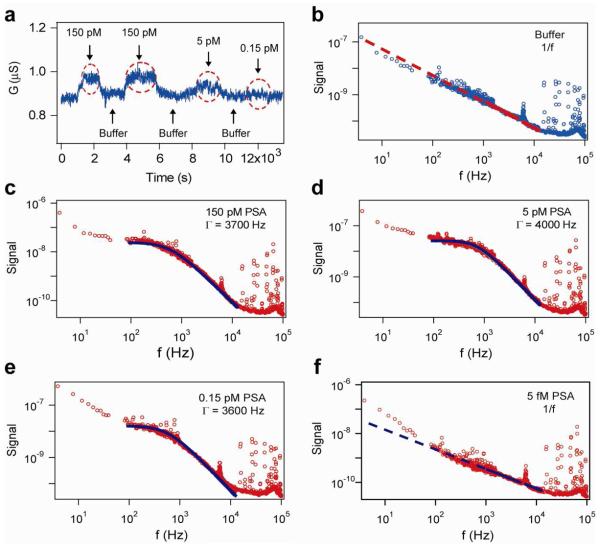
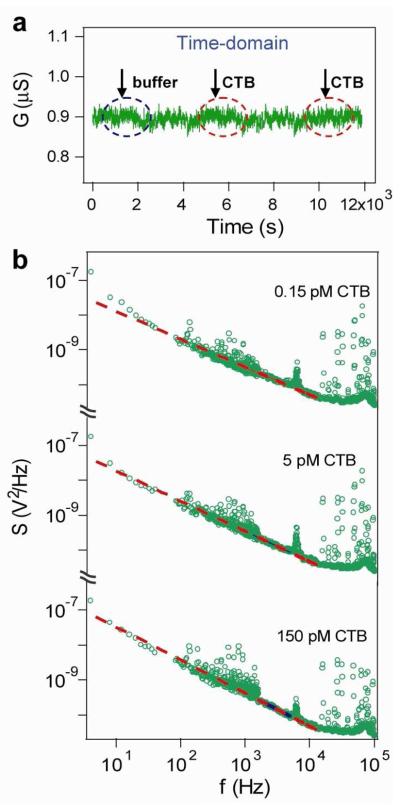
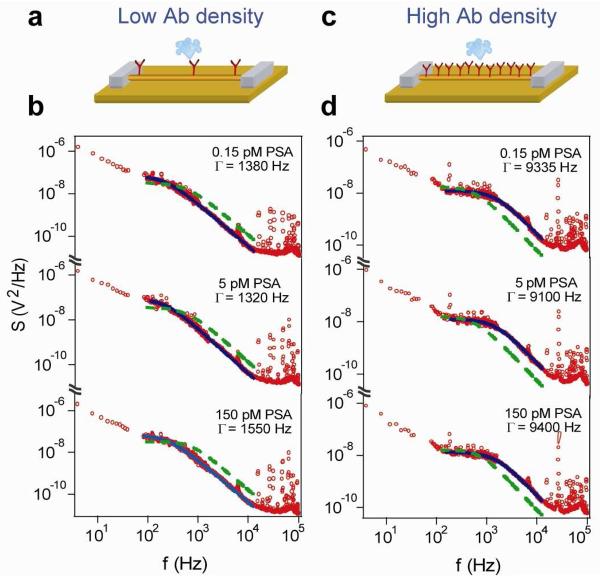
We demonstrate a new protein detection methodology based upon frequency domain electrical measurement using silicon nanowire field-effect transistor (SiNW FET) biosensors. The power spectral density of voltage from a current-biased SiNW FET shows 1/f-dependence in frequency domain for measurements of antibody functionalized SiNW devices in buffer solution or in the presence of protein not specific to the antibody receptor. In the presence of protein (antigen) recognized specifically by the antibody-functionalized SiNW FET, the frequency spectrum exhibits a Lorentzian shape with a characteristic frequency of several kilohertz. Frequency and conventional time domain measurements carried out with the same device as a function of antigen concentration show more than 10-fold increase in detection sensitivity in the frequency domain data. These concentration-dependent results together with studies of antibody receptor density effect further address possible origins of the Lorentzian frequency spectrum. Our results show that frequency domain measurements can be used as a complementary approach to conventional time domain measurements for ultrasensitive electrical detection of proteins and other biomolecules using nanoscale FETs.


Figures

Figure 1
Figure 1
(a) Schematic of protein binding and unbinding to an antibody-modified SiNW FET sensor. S and D correspond to the source and drain metal contacts to the NW. (b) A schematic of electrical noise in a time-domain measurement. (c) Schematic of Lorentzian and 1/f functions in the frequency domain. (d) Models of a two-level system (left) and an RC circuit (right).
Figure 2
Figure 2
(a) Time domain conductance measurement of a p-type SiNW FET sensor modified with PSA monoclonal antibodies, when different concentrations of PSA solutions (as shown) and pure buffer were sequentially delivered to the sensor. Red dashed circles indicate the time windows of PSA binding on the NW surface. (b) Power spectrum of the same SiNW FET sensor in buffer shows a 1/f frequency dependence. The data are blue circles and the 1/f dependence is shown as the red dashed line. (c-e) Power spectra recorded in solutions with different PSA concentrations, 150, 5, 0.15 pM, show Lorentzian shape curves, with characteristic frequencies (Γ) of 3700, 4000, and 3600 Hz, respectively. (f) Power spectrum recorded in 5 fM PSA solution shows a 1/f frequency dependence. The y-axis unit for Figs. (b-f) is V2/Hz. Data in (c-f) are red circles and fits are black dashed lines.
Figure 3
Figure 3
(a) Real-time conductance measurement of a p-type SiNW FET sensor modified with monoclonal antibodies to PSA, while different concentrations of CTB solutions and pure buffer were sequentially delivered onto the sensor surface. Black and red dashed circles indicate the time windows when buffer or CTB solutions were delivered onto the NW surface. (b) The power spectra of the same SiNW FET sensor in solutions with different CTB concentrations, 0.15, 5, 150 pM, respectively, show curves of 1/f shape. The data are green circles and fits are red dashed lines.
Figure 4
Figure 4
(a, c) Schematics illustrating SiNW FET sensors modified with antibodies at low and high density, respectively. (b, d) Power spectra recorded from devices modified with PSA antibodies at low and high density, respectively, for PSA concentrations from 0.15, 5 and 150 pM. The data are red circles, while black continuous lines correspond to Lorentzian fits. For comparison, a Lorentzian curve with a characteristic frequency of 3800 Hz is also added into each figure, shown in green dashed lines.

References

    1. Lieber CM, Wang ZL. MRS Bulletin. 2007;32:99–108.
    1. Xiang J, Lu W, Hu Y, Wu Y, Yan H, Lieber CM. Nature. 2006;441:489–493. - PubMed
    1. Pauzauskie PJ, Yang P. Materials Today. 2006;9:36–45.
    1. Cui Y, Wei Q, Park H, Lieber CM. Science. 2001;293:1289–1292. - PubMed
    1. Gao PAX, Zheng G, Lieber CM. Nano Lett. 2010;10:547–552. - PMC - PubMed

Publication types