

Microsatellite-based genetic diversity and population structure of domestic sheep in northern Eurasia
- PMID: 20698974
- PMCID: PMC2931448
- DOI: 10.1186/1471-2156-11-76
Microsatellite-based genetic diversity and population structure of domestic sheep in northern Eurasia
Abstract
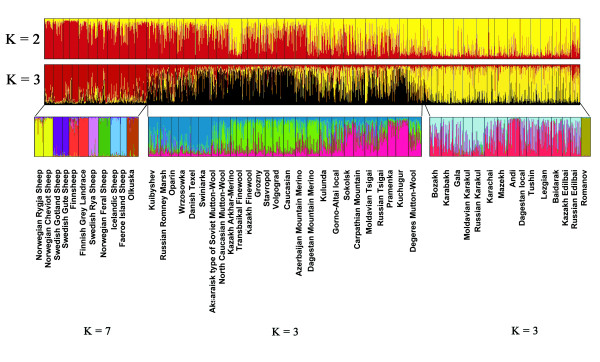
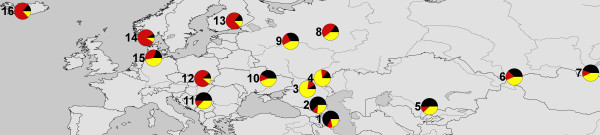
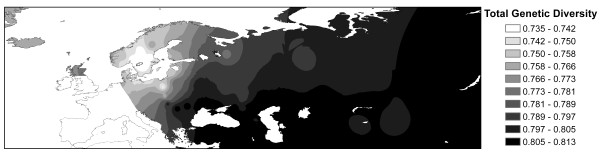
Background: Identification of global livestock diversity hotspots and their importance in diversity maintenance is essential for making global conservation efforts. We screened 52 sheep breeds from the Eurasian subcontinent with 20 microsatellite markers. By estimating and weighting differently within- and between-breed genetic variation our aims were to identify genetic diversity hotspots and prioritize the importance of each breed for conservation, respectively. In addition we estimated how important within-species diversity hotspots are in livestock conservation.
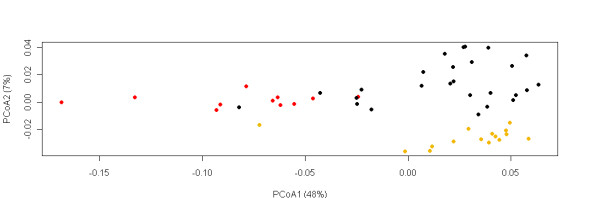
Results: Bayesian clustering analysis revealed three genetic clusters, termed Nordic, Composite and Fat-tailed. Southern breeds from close to the region of sheep domestication were more variable, but less genetically differentiated compared with more northern populations. Decreasing weight for within-breed diversity component led to very high representation of genetic clusters or regions containing more diverged breeds, but did not increase phenotypic diversity among the high ranked breeds. Sampling populations throughout 14 regional groups was suggested for maximized total genetic diversity.
Conclusions: During initial steps of establishing a livestock conservation program populations from the diversity hot-spot area are the most important ones, but for the full design our results suggested that approximately equal population presentation across environments should be considered. Even in this case, higher per population emphasis in areas of high diversity is appropriate. The analysis was based on neutral data, but we have no reason to think the general trend is limited to this type of data. However, a comprehensive valuation of populations should balance production systems, phenotypic traits and available genetic information, and include consideration of probability of success.
Figures
References
-
- Peters J, Driesch AV, Helmer D. The upper Euphrates-Tigris basin: cradle of agro-pastoralism. The First Steps of Animal Domestication. 2004.
-
- Ryder ML. In: World Animal Science. B8. Genetic Resources of Pig Sheep and Goat. Maijala K, editor. Amsterdam: Elsevier; 1991. Domestication, history and breed evolution in sheep; pp. 157–177.
-
- FAO. The State of World's Animal Genetic Resources for Food and Agriculture. Rome; 2007.
Publication types
MeSH terms
LinkOut - more resources
Full Text Sources
