. 2010 Aug 10:11:422.
doi: 10.1186/1471-2105-11-422.

baySeq: empirical Bayesian methods for identifying differential expression in sequence count data

Affiliations

baySeq: empirical Bayesian methods for identifying differential expression in sequence count data

Thomas J Hardcastle et al. BMC Bioinformatics. .

Abstract

Background: High throughput sequencing has become an important technology for studying expression levels in many types of genomic, and particularly transcriptomic, data. One key way of analysing such data is to look for elements of the data which display particular patterns of differential expression in order to take these forward for further analysis and validation.

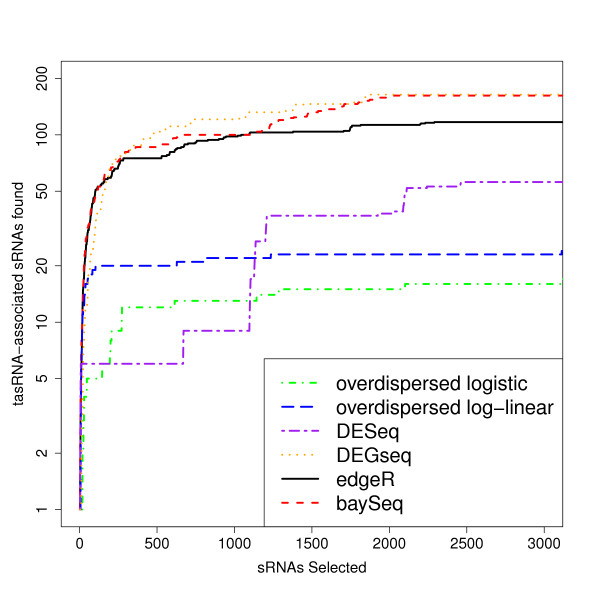
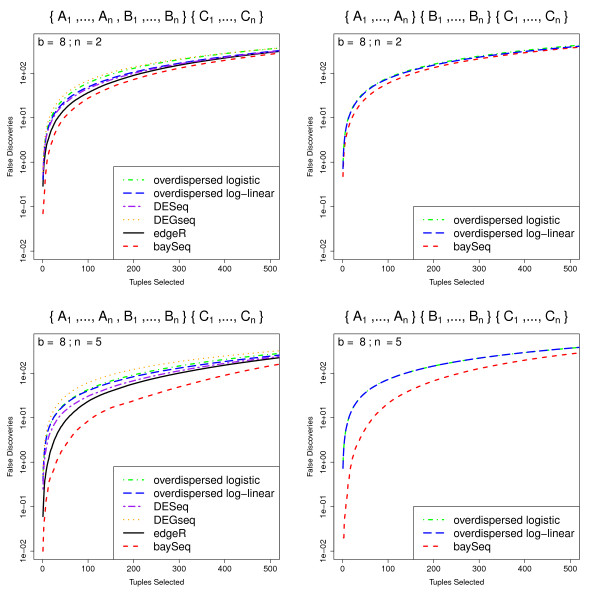
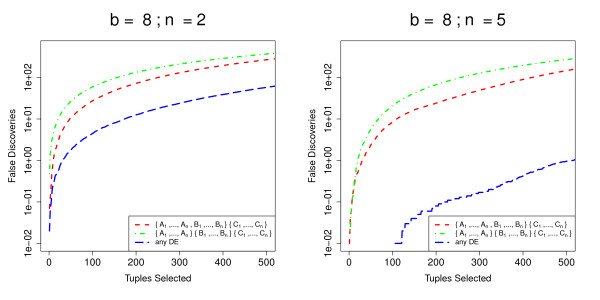
Results: We propose a framework for defining patterns of differential expression and develop a novel algorithm, baySeq, which uses an empirical Bayes approach to detect these patterns of differential expression within a set of sequencing samples. The method assumes a negative binomial distribution for the data and derives an empirically determined prior distribution from the entire dataset. We examine the performance of the method on real and simulated data.

Conclusions: Our method performs at least as well, and often better, than existing methods for analyses of pairwise differential expression in both real and simulated data. When we compare methods for the analysis of data from experimental designs involving multiple sample groups, our method again shows substantial gains in performance. We believe that this approach thus represents an important step forward for the analysis of count data from sequencing experiments.


Figures

Figure 1
Figure 1
Estimated posterior probabilities of differential expression against observed fold-change. Estimated posterior probabilities of differential expression against observed fold-change from a single simulation of ten thousand tuples, of which one thousand are truly differentially expressed (DE) and nine thousand are not differentially expressed (non-DE).
Figure 2
Figure 2
Mean FDR curves for different numbers of libraries and degrees of differential expression. Mean FDR curves, based on 100 simulations, comparing the performance of multiple methods in identifying pairwise differential expression. The data contain 1000 truly DE tuples and 9000 non-DE tuples and are simulated with varying number of libraries n1 and n2, different degrees of differential expression b, and randomly chosen dispersions for each tuple (~ Γ (0.85, 0.5)).
Figure 3
Figure 3
Mean ROC curves for data with constant dispersion. Mean ROC curves, based on 100 simulations, comparing the performance of multiple methods in identifying pairwise differential expression. The data contain 5000 truly DE tuples and 5000 non-DE tuples and are simulated from a negative binomial distribution with constant dispersion for all tuples ϕ = 0.17, 0.42 or 0.95.
Figure 4
Figure 4
(Log) p-values of real sequence data under null hypothesis of no overdispersion against mean expression levels of each sequence. (Log) p-values of real sequence data under the null hypothesis of no overdispersion and alternative hypothesis of overdispersion. We acquire these for each sequence by performing likelihood-ratio tests on the fit of a Poisson model and an alternative negative binomial model, allowing for both differences in library size and between the two sample types. Although a number of sequences show no significant variation from the Poisson model, a substantial number show very significant variation. The sequences for which overdispersion is particularly significant are those with high mean expression levels, as these are the sequences for which overdispersion can most easily be detected.
Figure 5
Figure 5
Number of tasRNA-associated small RNAs identified as differentially expressed in RDR6 knockout experiment. Number of tasRNA-associated small RNAs against the number of differentially expressed small RNAs at the top of each list acquired by each method in an analysis of small RNA data from two wild-type samples and two RDR6 knockout samples. We expect tasRNA-associated small RNAs to be under-expressed in the RDR6 knockout samples, and hence to find these amongst the differentially expressed tuples.
Figure 6
Figure 6
Mean FDR curves for analyses of more complex experimental designs. Mean FDR curves, based on 100 simulations, comparing the performance of multiple methods in identifying more complex patterns of differential expression. The data are simulated from samples coming from three experimental conditions A, B and C, giving a total of five possible patterns of differential expression. We show here the false discovery rates for the identification of tuples where one experimental condition differs from the other two ({A1, ..., An, B1, ..., Bn} {C1, ... Cn}) and for the identification of tuples where all three experimental conditions are different ({A1, ..., An}{B1, ... Bn}{C1, ... Cn}). The data are simulated with varying number of libraries n in each experimental condition.
Figure 7
Figure 7
Comparison of baySeqmethod's performance for different models in complex experimental designs. Mean FDR curves, based on 100 simulations, comparing the performance of the baySeq method in identifying differential expression of different types in an analysis of more complex experimental designs. The data are simulated from samples coming from three experimental conditions A, B and C, giving a total of five possible patterns of differential expression. We show here the false discovery rates for the identification of tuples where one experimental condition differs from the other two ({A1, ..., An, B1, ... Bn}{C1, ... Cn}) and for the identification of tuples where all three experimental conditions are different ({A1, ..., An}{B1, ... Bn}{C1, ... Cn}). We also show false discovery rates for the identification of tuples showing differential expression of any kind.

Similar articles

Cited by

References

    1. Margulies M, Egholm M, Altman WE, Attiya S, Bader JS, Bemben LA, Berka J, Braverman MS, Chen YJ, Chen Z, Dewell SB, Du L, Fierro JM, Gomes XV, Godwin BC, He W, Helgesen S, Ho CH, Ho CH, Irzyk GP, Jando SC, Alenquer ML, Jarvie TP, Jirage KB, Kim JB, Knight JR, Lanza JR, Leamon JH, Lefkowitz SM, Lei M, Li J, Lohman KL, Lu H, Makhijani VB, McDade KE, McKenna MP, Myers EW, Nickerson E, Nobile JR, Plant R, Puc BP, Ronan MT, Roth GT, Sarkis GJ, Simons JF, Simpson JW, Srinivasan M, Tartaro KR, Tomasz A, Vogt KA, Volkmer GA, Wang SH, Wang Y, Weiner MP, Yu P, Begley RF, Rothberg JM. Genome sequencing in microfabricated high-density picolitre reactors. Nature. 2005;437:376–380. - PMC - PubMed
    1. Bentley DR. Whole-genome re-sequencing. Curr Opin Genet Dev. 2006;16:545–552. doi: 10.1016/j.gde.2006.10.009. - DOI - PubMed
    1. Schuster SC. Next-generation sequencing transforms today's biology. Nat Methods. 2008;5:16–18. doi: 10.1038/nmeth1156. - DOI - PubMed
    1. Mardis ER. The impact of next-generation sequencing technology on genetics. Trends Genet. 2008;24:133–141. - PubMed
    1. Velculescu VE, Zhang L, Vogelstein B, Kinzler KW. Serial analysis of gene expression. Science. 1995;270:484–487. doi: 10.1126/science.270.5235.484. - DOI - PubMed

Publication types