. 2010 Oct;9(10):2793-802.
doi: 10.1158/1535-7163.MCT-10-0477. Epub 2010 Aug 10.

Renal cancer resistance to antiangiogenic therapy is delayed by restoration of angiostatic signaling

Affiliations

Renal cancer resistance to antiangiogenic therapy is delayed by restoration of angiostatic signaling

Rupal S Bhatt et al. Mol Cancer Ther. 2010 Oct.

Abstract

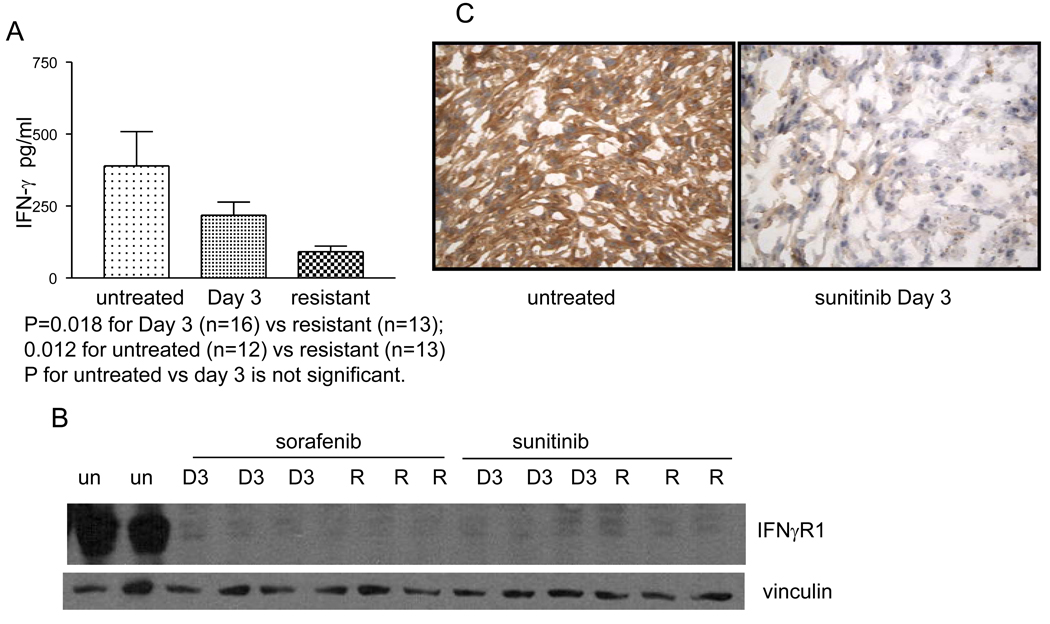
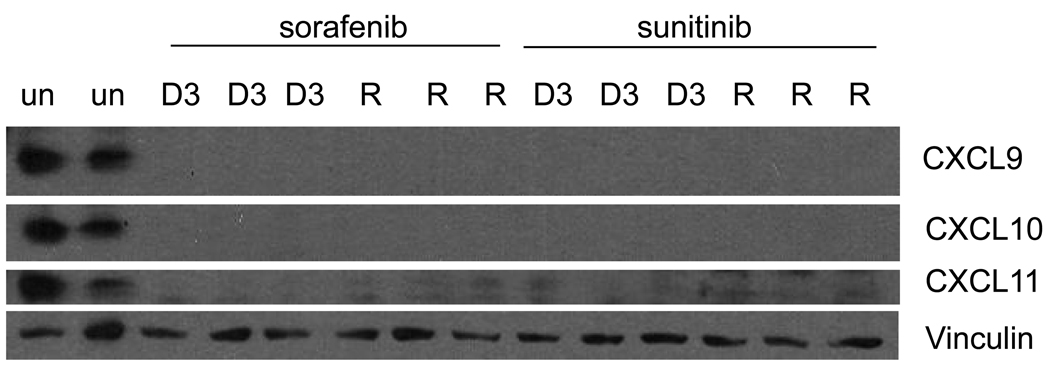
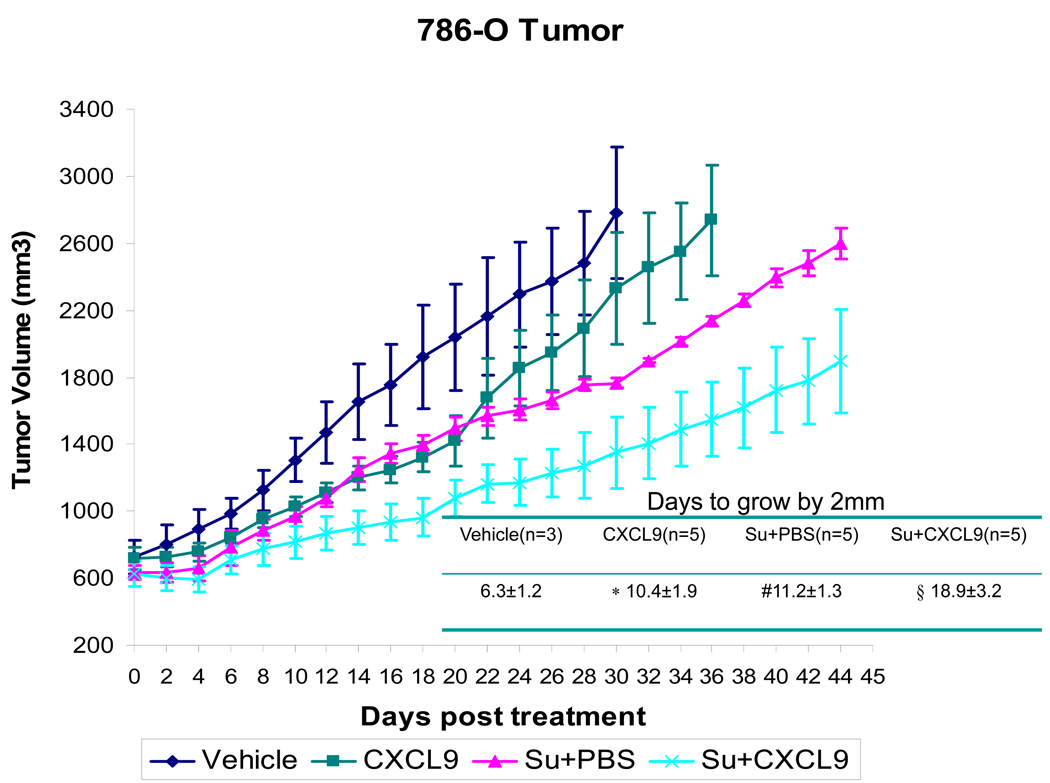
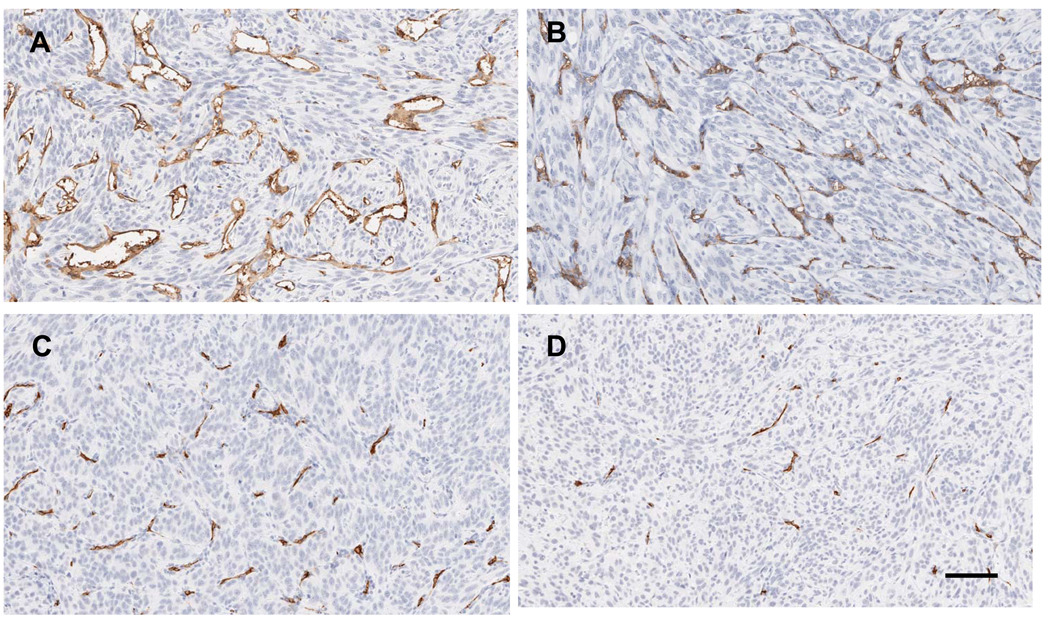
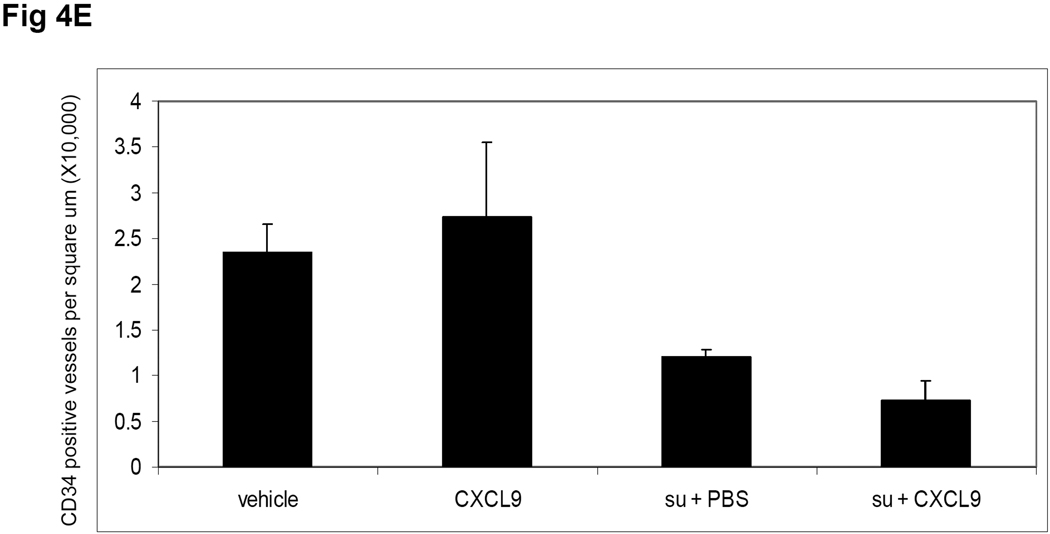
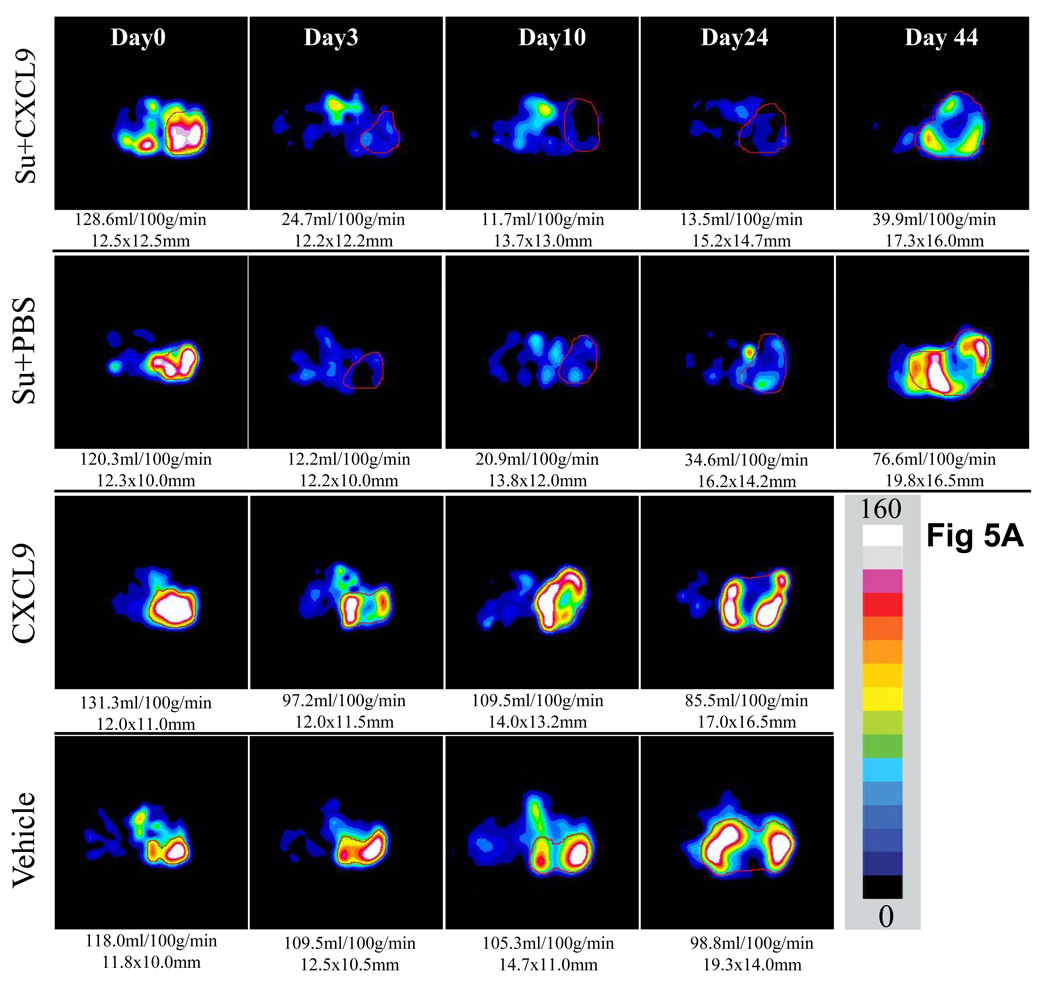
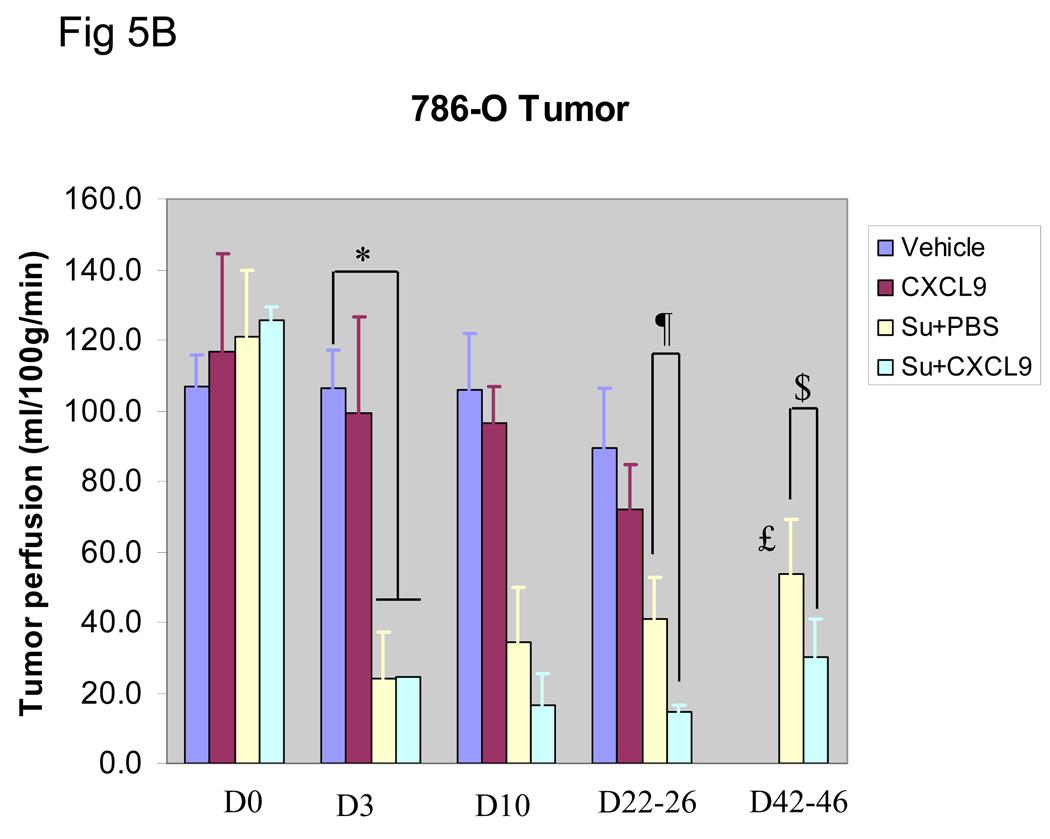
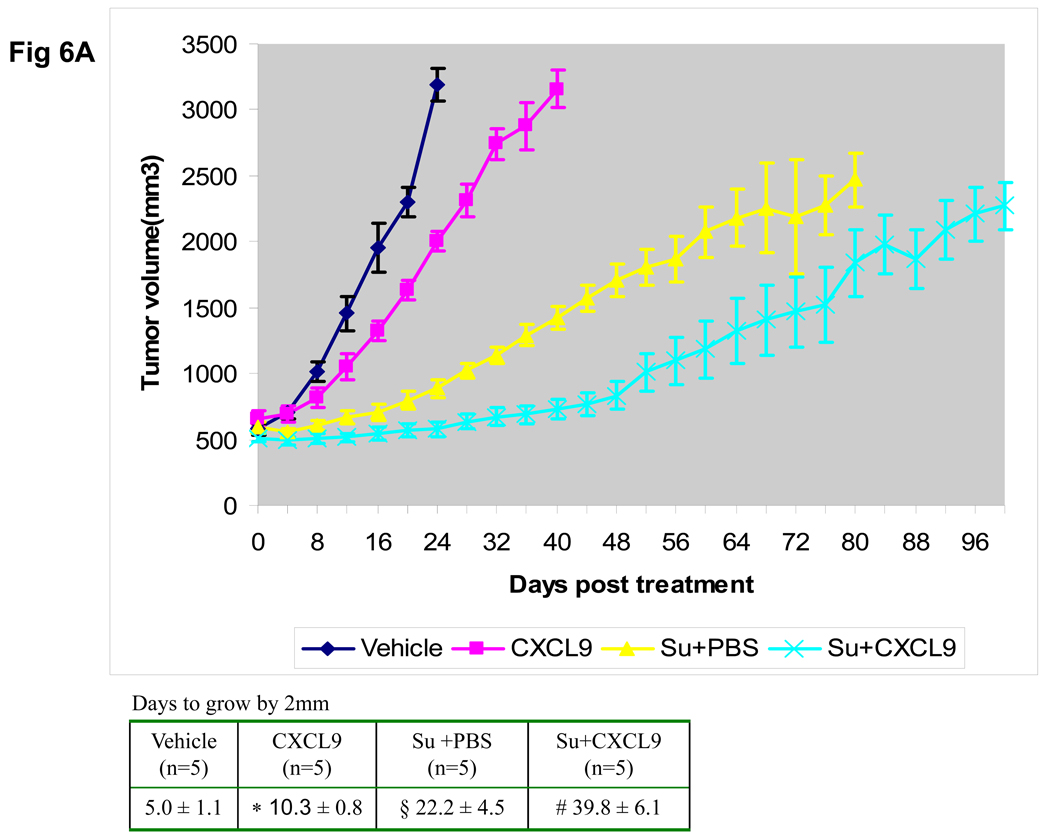
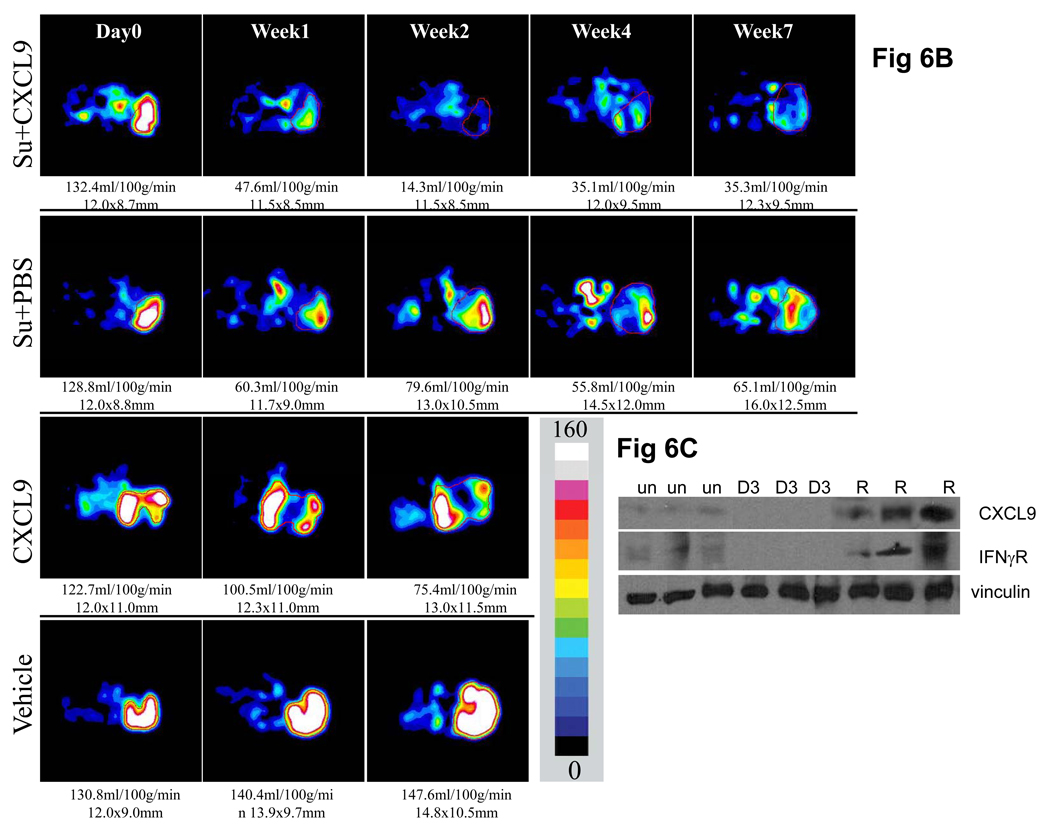
Treatment of metastatic renal cell cancer (RCC) with antiangiogenic agents that block vascular endothelial growth factor (VEGF) receptor 2 signaling produces tumor regression in a substantial fraction of patients; however, resistance typically develops within 6 to 12 months. The purpose of this study was to identify molecular pathways involved in resistance. Treatment of mice bearing either 786-0 or A498 human RCC xenografts with sorafenib or sunitinib produced tumor growth stabilization followed by regrowth despite continued drug administration analogous to the clinical experience. Tumors and plasma were harvested at day 3 of therapy and at the time of resistance to assess pathways that may be involved in resistance. Serial perfusion imaging, and plasma and tumor collections were obtained in mice treated with either placebo or sunitinib alone or in combination with intratumoral injections of the angiostatic chemokine CXCL9. Sunitinib administration led to an early downmodulation of IFNγ levels as well as reduction of IFNγ receptor and downstream angiostatic chemokines CXCL9 to 11 within the tumor. Intratumoral injection of CXCL9, although producing minimal effects by itself, when combined with sunitinib resulted in delayed resistance in vivo accompanied by a prolonged reduction of microvascular density and tumor perfusion as measured by perfusion imaging relative to sunitinib alone. These results provide evidence that resistance to VEGF receptor therapy is due at least in part to resumption of angiogenesis in association with reduction of IFNγ-related angiostatic chemokines, and that this resistance can be delayed by concomitant administration of CXCL9.


Figures

Figure 1
Figure 1
Plasma analysis of mice harboring tumors that were untreated (389.8+/−118.6pg/ml) (n=12 mice) Day 3 after initiation of sorafenib (218.5+/−45.5pg/ml) (n=16 mice) and that were resistant (90.76+/−20.0pg/ml) (n=13 mice) is shown (A). In the setting of resistance to sorafenib, plasma IFNγ decreases (P=0.018 for Day 3 vs resistant and for 0.012 for untreated vs resistant). Figure 1B is a Western analysis showing that IFNγR is down modulated at day 3 of therapy with sorafenib or sunitinib (D3) and at the time of resistance (R) as compared to untreated tumors (un). Results from tumors harvested from 2–3 different mice treated with the described conditions are shown. Figure 1C shows a representative IHC stain for IFNγR in an untreated tumor as compared to a tumor that was treated with sunitinib for 3 days. Staining is present in the untreated tumor and absent in the treated tumor.
Figure 2
Figure 2
Western analysis showing that CXCL9-11 are down modulated at day 3 of therapy (D3) with sorafenib or sunitinib and at the time of resistance (R) as compared to untreated tumors (un). Results from 2–3 representative tumors harvested from different mice treated with the described conditions are shown.
Figure 3
Figure 3
Growth curves depicting average tumor volume of 786-O derived tumors from mice treated with vehicle gavage (n=3), sunitinib + CXCL9 (n=5), sunitinib+ PBS (n=5), or intratumoral CXCL9 (n=5), are shown with standard error. As compared to vehicle treated controls or sunitinib treated mice, the growth of tumors treated with sunitnib+ CXCL9 exhibit a longer time to resistance shown in the accompanying table (#vehicle vs. sunitinib + PBS: p=0.002, *vehicle vs. CXCL9: p=0.016, § sunitinib + PBS vs. sunitinib + CXCL9 p=0.001). Comparisons were performed by Student’s T-test.
Figure 4
Figure 4
Tumor CD34 IHC at the time of sacrifice is shown in the following conditions: A. vehicle, B. CXCL9, C. sunitinib + PBS, D. sunitinib + CXCL9. Mice treated with sunitinib + PBS (n=3) were sacrificed when they reached 20mm in long axis and mice treated with sunitinib + CXCL9 (n=4) were sacrificed at the average day that the sunitinib treated mice were sacrificed. Mice treated with vehicle (n=3) and CXCL9 alone (n=3) were sacrificed at 20mm. The average MVD was quantified and is shown (E). P=0.014 for the comparison of sunitinib + PBS vs sunitinib + CXCL9. The scale bar is 100uM.
Figure 4
Figure 4
Tumor CD34 IHC at the time of sacrifice is shown in the following conditions: A. vehicle, B. CXCL9, C. sunitinib + PBS, D. sunitinib + CXCL9. Mice treated with sunitinib + PBS (n=3) were sacrificed when they reached 20mm in long axis and mice treated with sunitinib + CXCL9 (n=4) were sacrificed at the average day that the sunitinib treated mice were sacrificed. Mice treated with vehicle (n=3) and CXCL9 alone (n=3) were sacrificed at 20mm. The average MVD was quantified and is shown (E). P=0.014 for the comparison of sunitinib + PBS vs sunitinib + CXCL9. The scale bar is 100uM.
Figure 5
Figure 5
Serial tumor perfusion in a representative tumor treated with Vehicle as control, CXCL9 alone, sunitinib+ PBS, or sunitinib + CXCL9 as measured by ASL MRI is shown in A. The region of tumor is highlighted with red line in each image. The tumor size was measured with long and short axes (in mm) and the mean blood flow (in ml/100g/min) are shown below each image. Color scale represents range of perfusion values from 0 to 160ml/100g/min. In B, average perfusion with standard error is shown (n≥3 mice in all arms). The mice treated with sunitinib + PBS exhibited decreased perfusion that began to resume by week 3 (*P=0.04 for comparison of vehicle vs sunitinib treated mice, £ P=0.03 for comparison of day 3 vs day 45 of therapy with sunitinib + PBS). In contrast, mice treated with sunitinib + CXCL9 exhibited a greater reduction in tumor perfusion than with sunitinib + PBS that was maintained at week 3 (Day 22–26) and week 6 (Day 42–46) (¶ P=0.03 and $P=0.04 respectively).
Figure 5
Figure 5
Serial tumor perfusion in a representative tumor treated with Vehicle as control, CXCL9 alone, sunitinib+ PBS, or sunitinib + CXCL9 as measured by ASL MRI is shown in A. The region of tumor is highlighted with red line in each image. The tumor size was measured with long and short axes (in mm) and the mean blood flow (in ml/100g/min) are shown below each image. Color scale represents range of perfusion values from 0 to 160ml/100g/min. In B, average perfusion with standard error is shown (n≥3 mice in all arms). The mice treated with sunitinib + PBS exhibited decreased perfusion that began to resume by week 3 (*P=0.04 for comparison of vehicle vs sunitinib treated mice, £ P=0.03 for comparison of day 3 vs day 45 of therapy with sunitinib + PBS). In contrast, mice treated with sunitinib + CXCL9 exhibited a greater reduction in tumor perfusion than with sunitinib + PBS that was maintained at week 3 (Day 22–26) and week 6 (Day 42–46) (¶ P=0.03 and $P=0.04 respectively).
Figure 6
Figure 6
Growth curves of average volume of A498 derived xenograft tumors treated with sunitinib + PBS, sunitinib, + CXCL9, CXCL9, or vehicle are shown with standard error (n=5 in all arms)(A). As compared to untreated controls or sunitinib treated mice, the growth of tumors treated with sunitinib+ CXCL9 exhibit a longer time to grow by 2mm shown in the accompanying Table and a prolonged time of overall tumor growth (days of tumor growth from 12mm to 14mm: sunitinib + PBS vs. sunitinib + CXCL9, §P=0.0008). CXCL9 also slowed tumor growth but to a lesser extent than sunitinib + CXCL9 (*P<0.0001 for CXCL9 vs vehicle, #P<0.0001 for CXCL9 vs sunitinib + CXCL9). Figure 6B shows a representative set of perfusion images from a set of mice treated with Vehicle as control, CXCL9 alone, sunitinib + PBS or sunitinib + CXCL9 (this figure is representative of 3 mice per arm). The region of tumor is highlighted with red line in each image. The tumor size was measured with long and short axes (in mm) and the mean blood flow (in ml/100g/min) are shown below each image. Color scale represents range of perfusion values from 0 to 160ml/100g/min. Figure 6C shows the Western analysis for IFNγR and CXCL9 in A498 tumors in representative untreated tumors (un), day 3 of sunitinib (D3), and at the time of resistance (R). Comparisons were performed by Student’s T-test.
Figure 6
Figure 6
Growth curves of average volume of A498 derived xenograft tumors treated with sunitinib + PBS, sunitinib, + CXCL9, CXCL9, or vehicle are shown with standard error (n=5 in all arms)(A). As compared to untreated controls or sunitinib treated mice, the growth of tumors treated with sunitinib+ CXCL9 exhibit a longer time to grow by 2mm shown in the accompanying Table and a prolonged time of overall tumor growth (days of tumor growth from 12mm to 14mm: sunitinib + PBS vs. sunitinib + CXCL9, §P=0.0008). CXCL9 also slowed tumor growth but to a lesser extent than sunitinib + CXCL9 (*P<0.0001 for CXCL9 vs vehicle, #P<0.0001 for CXCL9 vs sunitinib + CXCL9). Figure 6B shows a representative set of perfusion images from a set of mice treated with Vehicle as control, CXCL9 alone, sunitinib + PBS or sunitinib + CXCL9 (this figure is representative of 3 mice per arm). The region of tumor is highlighted with red line in each image. The tumor size was measured with long and short axes (in mm) and the mean blood flow (in ml/100g/min) are shown below each image. Color scale represents range of perfusion values from 0 to 160ml/100g/min. Figure 6C shows the Western analysis for IFNγR and CXCL9 in A498 tumors in representative untreated tumors (un), day 3 of sunitinib (D3), and at the time of resistance (R). Comparisons were performed by Student’s T-test.

References

    1. Kaelin WG., Jr The von Hippel-Lindau protein, HIF hydroxylation, and oxygen sensing. Biochem Biophys Res Commun. 2005;338:627. - PubMed
    1. Motzer RJ, Michaelson MD, Redman BG, et al. Activity of SU11248, a multitargeted inhibitor of vascular endothelial growth factor receptor and platelet-derived growth factor receptor, in patients with metastatic renal cell carcinoma. J Clin Oncol. 2006;24:16–24. - PubMed
    1. Motzer RJ, Rini BI, Bukowski RM, et al. Sunitinib in Patients With Metastatic Renal Cell Carcinoma. JAMA. 2006;295:2516–2524. - PubMed
    1. Motzer RJ, Hutson TE, Tomczak P, et al. Sunitinib versus interferon alfa in metastatic renal-cell carcinoma. N Engl J Med. 2007;356:115–124. - PubMed
    1. Escudier B, Eisen T, Stadler WM, et al. TARGET Study Group. Sorafenib in advanced clear-cell renal-cell carcinoma. N Engl J Med. 2007;356:125–134. - PubMed

Publication types

MeSH terms

Substances