. 2010 Oct;38(18):e177.
doi: 10.1093/nar/gkq673. Epub 2010 Aug 10.

Single molecule linear analysis of DNA in nano-channel labeled with sequence specific fluorescent probes

Affiliations

Single molecule linear analysis of DNA in nano-channel labeled with sequence specific fluorescent probes

Somes K Das et al. Nucleic Acids Res. 2010 Oct.

Abstract

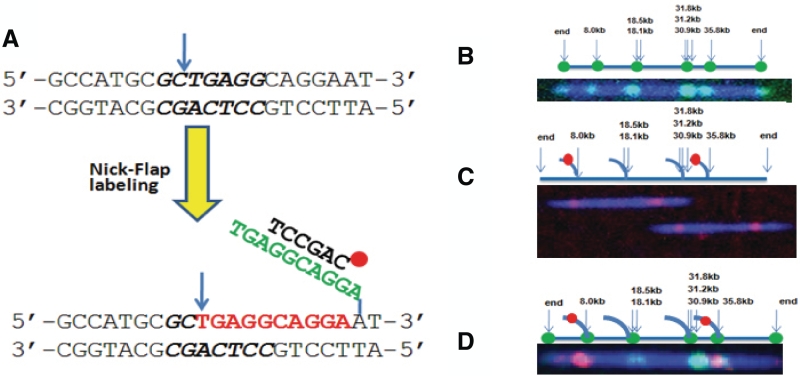
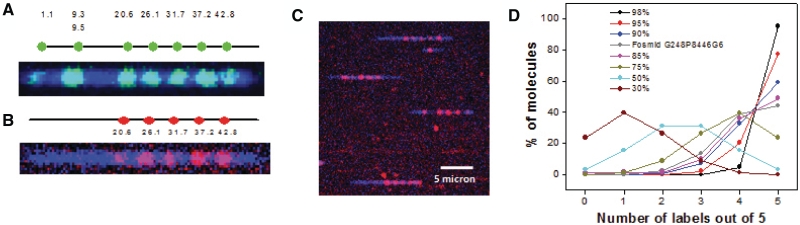
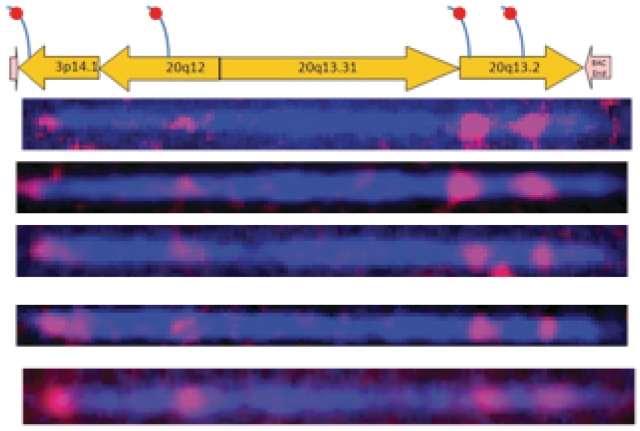
An array of nano-channels was fabricated from silicon based semiconductor materials to stretch long, native dsDNA. Here we present a labeling scheme in which it is possible to identify the location of specific sequences along the stretched DNA molecules. The scheme proceeds by first using the strand displacement activity of the Vent (exo-) polymerase to generate single strand flaps on nicked dsDNA. These single strand flaps are hybridized with sequence specific fluorophore-labeled probes. Subsequent imaging of the DNA molecules inside a nano-channel array device allows for quantitative identification of the location of probes. The highly efficient DNA hybridization on the ss-DNA flaps is an excellent method to identify the sequence motifs of dsDNA as it gives us unique ability to control the length of the probe sequence and thus the frequency of hybridization sites on the DNA. We have also shown that this technique can be extended to a multi color labeling scheme by using different dye labeled probes or by combining with a DNA- polymerase-mediated incorporation of fluorophore-labeled nucleotides on nicking sites. Thus this labeling chemistry in conjunction with the nano-channel platform can be a powerful tool to solve complex structural variations in DNA which is of importance for both research and clinical diagnostics of genetic diseases.


Figures

Figure 1.
Figure 1.
Image of the nano-channel array in a chip that has been used for the linearization of DNA. (A) Different regions of a nano-channel device. (B) Image showing the translocation of DNA through different areas (microstructure and nano-channel) of the chip. (C) Image of the relaxed and linearized DNA molecules inside nano-channel array. (D) Size distribution of BAC 3F5 DNA molecules inside nano-channel array.
Figure 2.
Figure 2.
Schematic drawing of recognition sequence of nicking endonuclease Nb.BbvCI and the Nick–Flap labeling scheme. (A) After nicking (blue arrow) at the recognition sequence (GCTGAGG, Nb.BbvCI), fluorescent or non-labeled nucleotides (red) are incorporated using a polymerase with displacement activity but lacking 5′→3′ exonulcease activity. As a result, the native sequences are displaced (green) downstream. A ssDNA structure (flap) is generated and can be interrogated with various chemistry including hybridization probes. For example, an oligo probe (black) can hybridize to the flap. (B) Nick-labeling of λ-DNA molecules. The top graph shows the distribution of the seven nick endonuclease Nb.BbvCI recognition sites of λ-DNA. The solid blue line represents the backbone of the λ-DNA, the arrow indicates the positions of the predicted Nb.BbvCI sites and the green dots represent the potential tagging sites. The bottom graph shows a single labeled λ-DNA molecule. Backbone was labeled with YOYO-1 (blue) and nicking sites were labeled with Alexa-546 dUTP nucleotides and four internal labels were observed and matched well with predicted sites. (C) Flap-labeling. Two labeled flap sites are shown in red dots on a solid line peeling off the DNA backbone in top graph. The bottom graph shows two λ-DNA molecules, whose flap sites at 8 and 35.5 kb were hybridized and labeled with probes Cy3-AAGGTCTTGAGCAGGCCGTT-Cy3 and Cy3-TCCAACTATATAATTT-GACCAGAGAACAAG-Cy3, respectively. In this case the nicking sites were not labeled. (D) Nick–flap labeling. All nicking sites of λ-DNA molecules were labeled with Alexa 647 dUTP (green) and two flap sequences at nicking sites of 8 kb and 35.5 kb were selectively hybridized and labeled with green probes Cy3-AAGGTCTTGA-GCAGGCCGTT-Cy3 and Cy3-TCCAACTATATAA-TTTGACCAGAGAACAAG-Cy3, respectively.
Figure 3.
Figure 3.
Image of Fosmid G248P8446G6 DNA in nano-channel (60 nm × 100 nm). The DNA was nicked with Nb.BbvCI and the free 3′ end is extended by Vent (exo-) in presence of a mixture of three unlabeled nucleotides (dAGC) and Alexa-546 labeled dUTP (Figure 3A) or a mixture of four unlabeled nucleotides (dNTP) (Figure 3B). The DNA backbone was stained with intercalated dye YOYO-1 iodide. (A) Eight nicked sites were thus labeled with Alexa 546 (green). Two nicking sites at ∼9.3 and ∼9.5 kb were too close to resolve optically. The DNA backbone is indicated as a blue line. The positions of the labeled dyes match well with the predicted nicking positions on the backbone. (B) The generated single strand flaps (by nick translation in presence of dNTP mixtures) were hybridized with dye labeled probe of sequences Cy3-TGCCTGTGAGAGG-AAATCTCAACTCTCTT-Cy3. Five out of the eight single strand flaps contain the complement of the probe sequence and thus get hybridized. (B) shows five labels (red) along with the blue backbone. All these positions match well with the predicted ones (6). (C) Image shows several full length flap labeled Fosmid molecules inside a nano-channel array. (D) The prediction of labeling efficiency of one site in a DNA molecule with maximum five labeling sites available in it. The lines show the changes in the number distribution of 1, 2, 3, 4 and 5 labeled molecules with change in labeling efficiencies (30, 50, 75, 85, 90, 95 and 98%). The gray line is the distribution of number of molecules that were experimentally obtained from the flap labeled (five sites) Fosmid G248P8446G6. This line shows its labeling efficiency ∼85–90%. The imaging procedure is described in the ‘Material and Methods’ section.
Figure 4.
Figure 4.
Mapping BAC clone 3F5. (A) A two color superimposed image shows several dsDNA molecules (blue, YOYO-1 stained backbone) and selectively labeled flaps (red) with one universal probe Cy3-ATT+CTCCTGCC+TCA-Cy3 (+C and +T are LNA bases) in the nano-channel array (60 × 100 nm channel). (B) The predicted sequence tagging motif map, square indicating the perfect sequence match between probe and flap sequences, while the circle representing one mismatch. (C) Several full length dsDNA molecules (blue, YOYO-1 stained backbone) and hybridized labels (red) are lined up against the predicted map in Figure 4B (18). (D) Sequence motif map calculated based on the distance from one end and matchs well with the predicted map.
Figure 5.
Figure 5.
Validation of structural variations. Top graph indicates the predicted locations of probe sequences on different segments. Bottom graph shows several labeled dsDNA molecules match well with the predicted map with four probes hybridized to different segments (i) TCCTTGGTTGACCTAACAACACA (3p14.1), (ii) TGCCACCTACCCCT (20q12), (iii) TCCAAGTCTCAGTGACCCT (20q13.2) and (iv) ACTGTAGTCTTGAATTCCTGA (20q13.2).

References

    1. Feuk L, Carson AR, Scherer SW. Structural variation in the human genome. Nat. Rev. Genet. 2006;7:85–97. - PubMed
    1. Szatmari P, Paterson AD, Zwaigenbaum L, Roberts W, Brian J, Liu XQ, Vincent JB, Skaug JL, Thompson AP, Senman L, et al. Mapping autism risk loci using genetic linkage and chromosomal rearrangements. Nat. Genet. 2007;39:319–328. - PMC - PubMed
    1. Estivill X, Cheung J, Pujana MA, Nakabayashi K, Scherer SW, Tsui LC. Chromosomal regions containing high-density and ambiguously mapped putative single nucleotide polymorphisms (SNPs) correlate with segmental duplications in the human genome. Hum. Mol. Genet. 2002;11:1987–1995. - PubMed
    1. Locke DP, Segraves R, Carbone L, Archidiacono N, Albertson DG, Pinkel D, Eichler EE. Large-scale variation among human and great ape genomes determined by array comparative genomic hybridization. Genome Res. 2003;13:347–357. - PMC - PubMed
    1. Korbel JO, Urban AE, Affourtit JP, Godwin B, Grubert F, Simons JF, Kim PM, Palejev D, Carriero NJ, Du L, et al. Paired-end mapping reveals extensive structural variation in the human genome. Science. 2007;318:420–426. - PMC - PubMed

Publication types

MeSH terms