. 2010 Aug 10;107(32):14508-13.
doi: 10.1073/pnas.1006551107.

Analysis of proteome dynamics in the mouse brain

Affiliations

Analysis of proteome dynamics in the mouse brain

John C Price et al. Proc Natl Acad Sci U S A. .

Erratum in

  • Proc Natl Acad Sci U S A. 2014 Mar 4;111(9):3645

Abstract

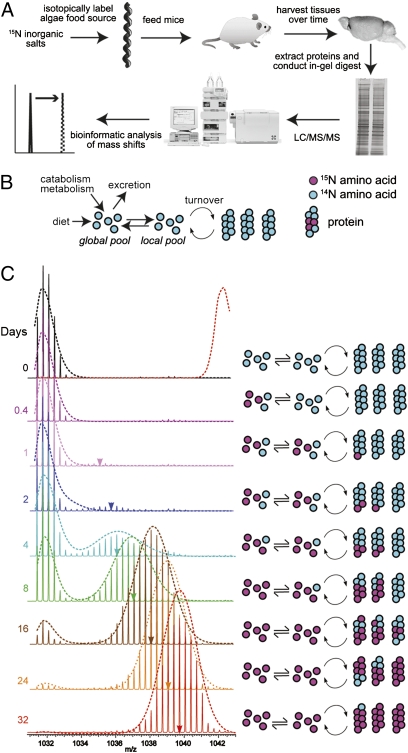
Advances in systems biology have allowed for global analyses of mRNA and protein expression, but large-scale studies of protein dynamics and turnover have not been conducted in vivo. Protein turnover is an important metabolic and regulatory mechanism in establishing proteome homeostasis, impacting many physiological and pathological processes. Here, we have used organism-wide isotopic labeling to measure the turnover rates of approximately 2,500 proteins in multiple mouse tissues, spanning four orders of magnitude. Through comparison of the brain with the liver and blood, we show that within the respective tissues, proteins performing similar functions often have similar turnover rates. Proteins in the brain have significantly slower turnover (average lifetime of 9.0 d) compared with those of the liver (3.0 d) and blood (3.5 d). Within some organelles (such as mitochondria), proteins have a narrow range of lifetimes, suggesting a synchronized turnover mechanism. Protein subunits within complexes of variable composition have a wide range of lifetimes, whereas those within well-defined complexes turn over in a coordinated manner. Together, the data represent the most comprehensive in vivo analysis of mammalian proteome turnover to date. The developed methodology can be adapted to assess in vivo proteome homeostasis in any model organism that will tolerate a labeled diet and may be particularly useful in the analysis of neurodegenerative diseases in vivo.


Conflict of interest statement

The authors declare no conflict of interest.

Figures

Fig. 1.
Fig. 1.
Protocol, model, and analysis of global turnover rates. (A) Experimental protocol. 15N inorganic salts are used to make broth for cultures of Spirulina. Dried 15N-labeled algae is used to supply protein in mouse diet. At designated time points, samples were collected. Tissues were homogenized and fractionated according to molecular weight in a 1D SDS/PAGE gel. In-gel digests liberate peptides from the gel, which are then analyzed by LC/MS/MS. The change in molecular weight and the relative populations of labeled peptides are compared in proteome-wide bioinformatic analyses. (B) Three-pool kinetic model for the incorporation of 15N-labeled amino acids into proteins. Amino acids in the global pool circulate between local tissue pools. (C) Sample spectral data showing the incorporation of 15N over time in a Cofilin-1 tryptic peptide. A shift in centroid mass (colored arrowheads) as well as the change in the relative ratios of unlabeled to labeled peptide populations (integrated peak areas) increase with time. The observed data fit with predictions in mass spectral changes as a function of labeling time as calculated by a three-pool model (dotted line overlaying each spectrum.) The dotted red line overlaying the 0-d time point represents the predicted fully labeled spectrum. The corresponding schematics on the Right represent the theorized labeling of the protein, local amino acid, and global amino acid pools in accordance with the three-pool model.
Fig. 2.
Fig. 2.
The kinetics of peptide-labeled populations (A) and mass shifts (B). Measurements (symbols) were made for individual peptides from the designated proteins extracted from brain, liver, and blood. UniProtKB/Swiss-Prot accession codes are indicated.
Fig. 3.
Fig. 3.
Distribution and comparison of protein turnover rates in the brain, liver, and blood. (A) Distribution of turnover rates. In the brain, proteins had longer turnover times whereas the distributions of the blood and liver proteins were skewed toward faster turnover rates. The median turnover rate for the brain peptides was 0.075 d−1 compared with 0.23 and 0.20 d−1, respectively, for the blood and liver proteins. Thus, the average lifetimes of proteins in the brain, liver, and blood are 9.0, 3.0, and 3.5 d, respectively. Each bar represents the fraction of the total protein population within the rate bin. The x axis represents the low limit of the bin at 0.25 log d−1 intervals. (B) Comparison of turnover rates of proteins shared between tissues. Gray dots represent mitochondrial proteins.
Fig. 4.
Fig. 4.
Correlations between function and turnover rates. Functional categories based on the Gene Ontology (GO) Database were clustered into the categories listed along the y axis. The turnover rates for proteins belonging to the GO clusters were enriched (shown by grayscale shading) with high statistical significance (P < 0.001) for the indicated rate bin. The constituent GO terms, proteins, and turnover rates for each cluster are listed in Table S1.
Fig. 5.
Fig. 5.
Turnover rates of analyzed subunit proteins that comprise multiprotein complexes. Boxes show the interquartile range (IQR) of turnover rates of protein complex subunits. The error bar represents the entire range of rates and the dots represent outliers (1.5 IQR). Numbers in parentheses indicate the number of protein subunits analyzed and represented in the distribution. Complexes observed in multiple tissues share the same box color; white boxes indicate that complex was detected in that tissue only.

References

    1. Goldberg AL, St John AC. Intracellular protein degradation in mammalian and bacterial cells: Part 2. Annu Rev Biochem. 1976;45:747–803. - PubMed
    1. Mortimore GE, Pösö AR, Lardeux BR. Mechanism and regulation of protein degradation in liver. Diabetes Metab Rev. 1989;5:49–70. - PubMed
    1. Rousset S, et al. UCP2 is a mitochondrial transporter with an unusual very short half-life. FEBS Lett. 2007;581:479–482. - PubMed
    1. Verzijl N, et al. Effect of collagen turnover on the accumulation of advanced glycation end products. J Biol Chem. 2000;275:39027–39031. - PubMed
    1. Ivan M, et al. HIFalpha targeted for VHL-mediated destruction by proline hydroxylation: Implications for O2 sensing. Science. 2001;292:464–468. - PubMed

Publication types

LinkOut - more resources