Comparative Study
. 2010 Aug;22(8):2579-93.
doi: 10.1105/tpc.110.075754. Epub 2010 Aug 10.

Finite element model of polar growth in pollen tubes

Affiliations
Comparative Study

Finite element model of polar growth in pollen tubes

Pierre Fayant et al. Plant Cell. 2010 Aug.

Abstract

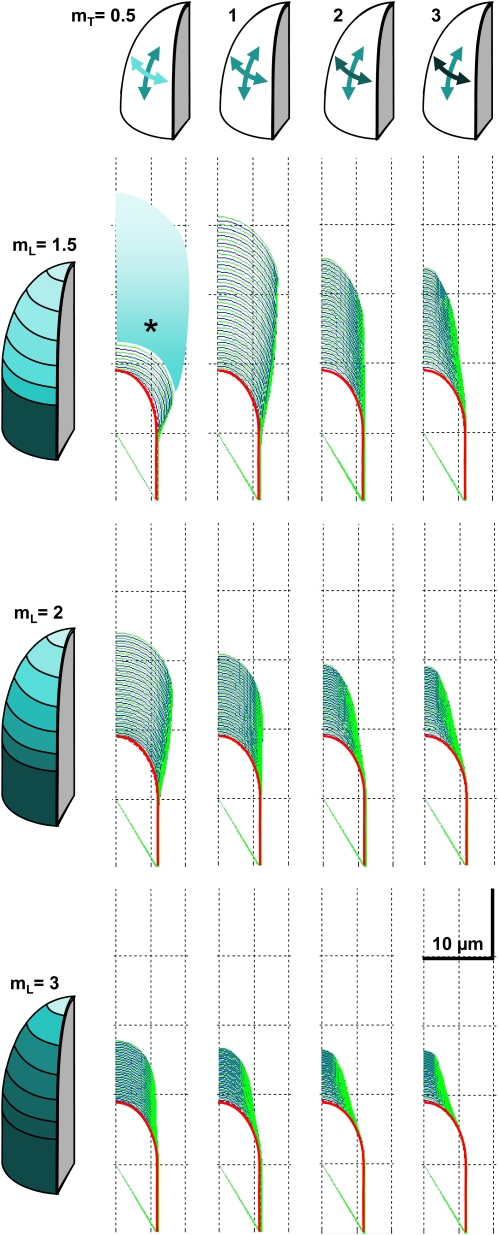
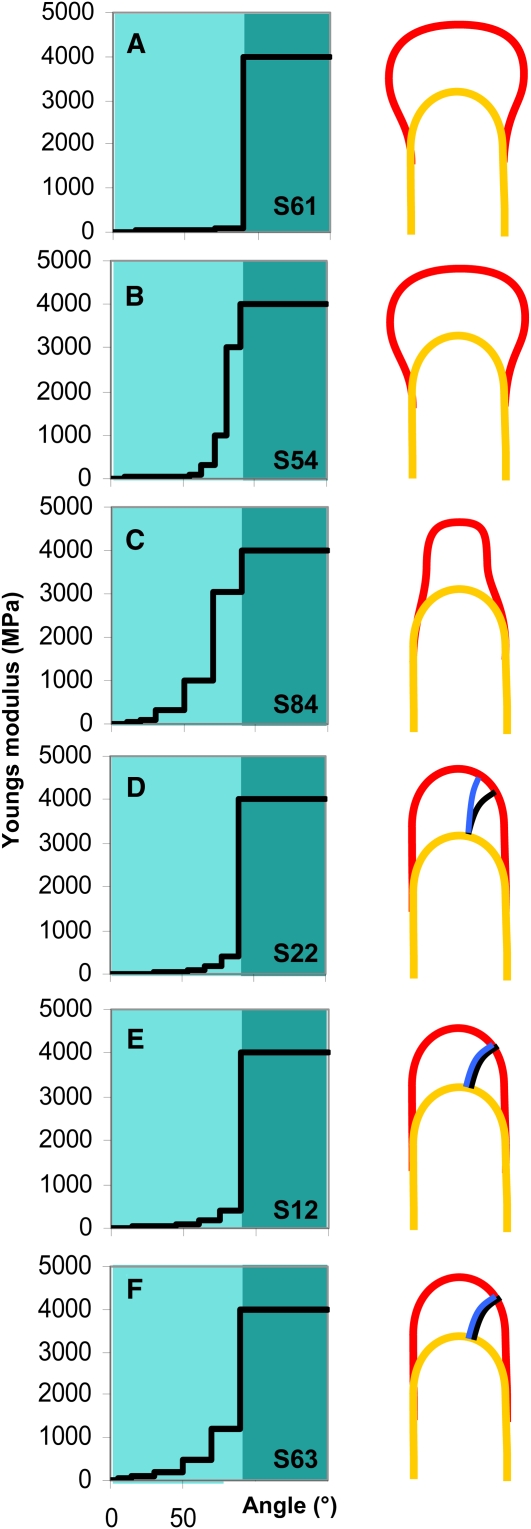
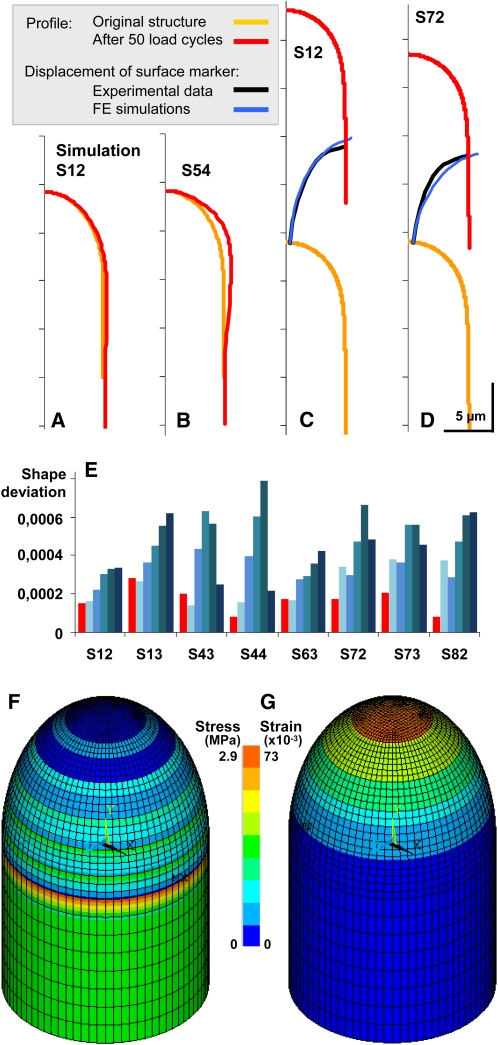
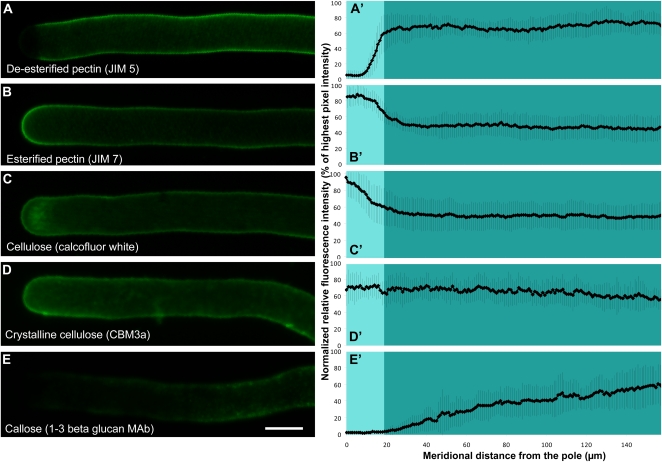
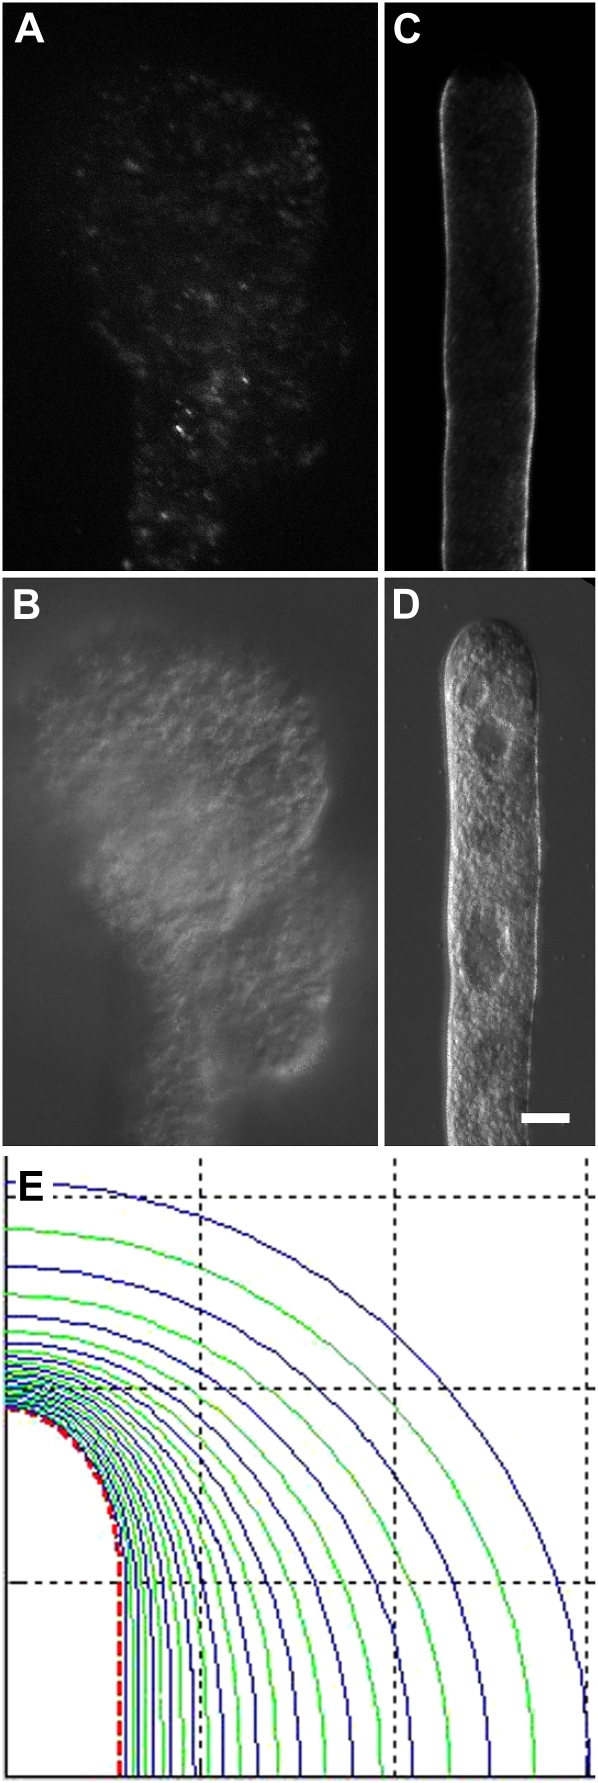
Cellular protuberance formation in walled cells requires the local deformation of the wall and its polar expansion. In many cells, protuberance elongation proceeds by tip growth, a growth mechanism shared by pollen tubes, root hairs, and fungal hyphae. We established a biomechanical model of tip growth in walled cells using the finite element technique. We aimed to identify the requirements for spatial distribution of mechanical properties in the cell wall that would allow the generation of cellular shapes that agree with experimental observations. We based our structural model on the parameterized description of a tip-growing cell that allows the manipulation of cell size, shape, cell wall thickness, and local mechanical properties. The mechanical load was applied in the form of hydrostatic pressure. We used two validation methods to compare different simulations based on cellular shape and the displacement of surface markers. We compared the resulting optimal distribution of cell mechanical properties with the spatial distribution of biochemical cell wall components in pollen tubes and found remarkable agreement between the gradient in mechanical properties and the distribution of deesterified pectin. Use of the finite element method for the modeling of nonuniform growth events in walled cells opens future perspectives for its application to complex cellular morphogenesis in plants.


Figures

Figure 1.
Figure 1.
Differential Interference Contrast Micrographs of in Vitro–Growing Lily Pollen Tubes. (A) Normally growing tube. The geometry of the tube can be described with a cylinder of radius rT capped by a half prolate spheroid with short radii rT and a long radius rL. The dotted line describes the two-dimensional profile of the shape defined by an ellipse and a rectangle. (B) Tube showing a swelling apical region. Solid lines describe the diameter of the tube at different locations. Dotted line indicates the length of the distal diameter for comparison. (C) Tube showing a tapering apical region. Solid lines describe the diameter of the tube at different locations. Dotted line indicates the length of the distal diameter for comparison. Bar = 10 μm
Figure 2.
Figure 2.
FE Structure of a Tip-Growing Cell. Initial structure (A) and structure after 50 load cycles ([B] and [C]) in the case of self-similar elongation. The figures show the full 360° structure and the 90° structure marked in darker color in (A). For most calculations, only the 90° structure is used to exploit radial geometry. The apical region of the cell wall is divided into six ring-shaped surface domains defined by the angles θ1 through θ6, originating from the center of the prolate spheroid (D). Because of its different geometry, domain 1 is meshed using a different method than domains 2 through 7. This resulted in irregularly arranged shell elements in the pole region (C). The shape of the pollen tube is defined by the short radii rT and the long radius rL of the half prolate spheroid and the thickness t of the shell elements representing the cell wall. Deformation resulting from load application causes the displacement of key points defining surface regions (E). These are redefined after remeshing based on the domain angles θi (D).
Figure 3.
Figure 3.
Subset of Simulations Showing the Deformation of the Cell Wall Structure after 50 Load Cycles. Different values for mL (rows) and mT (columns) were tested. Relative anisotropy defined by mT values are also symbolized in the color shades of the arrows, with dark color standing for stiffer material properties. The profile of the original structure is indicated by the red line. Alternating blue and green lines indicate the results of repeated load cycles. In this subset, the domain angles were identical, with θi = 15° for i = 1 to 6. Various combinations of multiplication factors mL and mT demonstrate that for this particular angle distribution, self-similarity was obtained for mL = 2 and mT = 1. The asterisk indicates an error occurring after the 12th loading cycle due to instability in the structure.
Figure 4.
Figure 4.
Spatial Distribution of the Young's Modulus in the Meridional Direction of a Representative Subset of Simulations. For all simulations, mT = 1. The apical dome (domains 1 to 6) is indicated with light teal and the cylindrical shank with dark teal (domain 7). Swelling of the apex could be caused by a shallow gradient (A) or by a large polar domain with low Young's modulus and a late onset in the increase of the modulus (B). Tapering was caused by a steeper gradient (C). Self-similar growth could be achieved by various parameter combinations ([D] to [F]), but these did not necessarily produce the surface strain patterns observed in growing pollen tubes (D). The simulations producing a good fit with these strain patterns ([E] and [F]) showed a steady, moderate increase in the Young's modulus within the apical dome and a sudden jump at the transition region to the shank. Yellow line indicates original shape of the cell, and the red line shows tube shape after repeated load cycles. Blue lines indicate paths of surface markers obtained from the simulation, and black lines show experimental data obtained from E.R. Rojas and J. Dumais (unpublished data).
Figure 5.
Figure 5.
Quantitative Validation of Simulations. (A) and (B) Self-similarity was assessed quantitatively by comparing the shape profile of a tube after 100 loading cycles (red) with the original structure (orange). Self-similarity was excellent for several simulations (e.g., S12; [A]), but in most others, the resulting shape was very different from the original shape (e.g., S54; [B]). (C) and (D) Surface deformation was assessed by comparing the paths of surface markers obtained from the simulation (blue) with experimental data obtained from E.R. Rojas and J. Dumais (unpublished data) (black). Only a few simulations showed very good agreement between both curves (e.g., S12; [C]), whereas others showed varying degrees of deviation from the experimental data (e.g., S72; [D]). (E) Quantitative assessment of the quality of eight simulations previously selected based on qualitative inspection. The red bars indicate the deviation from self-similarity. The blue bars indicate the deviations in the displacement trajectories of five surface markers per simulation. (F) Distribution of local stresses upon load application on the surface of the 360° structure using parameter combination S12. Blue indicates low stress at the pole and green higher stress in the shank. Ring-shaped regions of locally increased stress (green, yellow, and orange) are due to discrete steps in Young's modulus between surface domains, inherent to the approximate approach chosen here. (G) Distribution of local strain upon load application on the surface of the 360° structure using parameter combination S12. Blue color indicates low or absent strain in the shank, and orange indicates high strain at the pole. Despite the stress artifacts observed in (F), the strain distribution is rather gradual and does not show local maxima.
Figure 6.
Figure 6.
Effect of Cell Wall Thickness, Turgor Pressure, Tube Radius, and Structure on the Growth Pattern. Cell wall thickness t, turgor pressure P, and tube radius rT were altered in biologically relevant ranges to test their effect on deformation geometry. The nature of apical deformation (self-similar, swelling, and tapering) was not affected by any of the three parameters. The only characteristic altered was the increase in tube length per loading cycle. Simulations performed with a 360° structure demonstrated that it behaved identically to the corresponding 90° structure. All graphs show length profiles. The graphs on the left show the gradient in mechanical properties used for the respective simulations, as determined by mL and the size distribution of the surface domains. Light teal indicates the apical dome and dark teal the cylindrical shank. The right column shows three-dimensional representations of the 360° structures. The profile of the original structure is indicated by the red line. Alternating blue and green lines indicate the results of repeated load cycles. In all simulations, mT = 1.
Figure 7.
Figure 7.
Spatial Distribution of Cell Wall Components in in Vitro–Growing Lily Pollen Tubes. Cells were treated with specific antibodies and histochemical stains for pectins with a low (A) and high (B) degree of esterification, cellulose (C), crystalline cellulose (D), and callose (E). Graphs (A') to (E') show the corresponding relative fluorescence intensity along the perimeter of the cell, normalized for each tube, and averaged over at least 10 tubes. Vertical bars are standard errors. Light teal indicates the apical dome and dark teal the cylindrical shank. Bar = 20 μm.
Figure 8.
Figure 8.
Effect of Pectin Digestion on Pollen Tube Shape. (A) to (D) Pregerminated pollen tubes were treated with pectinase for 15 min ([A] and [B]). Pollen tubes exposed to the enzyme were swollen at the apex (A), whereas untreated tubes elongated in self-similar manner (C). Immunofluorescence label with JIM5 revealed the near absence of pectins with a low degree of methylesterification in enzyme-treated samples (B) compared with the control tubes not treated with the enzyme (D). Note that the images should not be compared quantitatively since in order to reveal residual label in the enzyme-treated samples, exposure time had to be at least tripled compared with the control sample. Fluorescence micrographs ([A] and [C]) and corresponding differential interference contrast micrographs ([B] and [D]). Bar = 10 μm. (E) FE simulation using identical Young's modulus for surface domains 1 through 7 resulted in spherical swelling of the structure. The profile of the original structure is indicated by the red, dashed line. Alternating blue and green lines indicate the results of repeated load cycles. [See online article for color version of this figure.]

Similar articles

Cited by

References

    1. Aouar L., Chebli Y., Geitmann A. (2010). Morphogenesis of complex plant cell shapes - The mechanical role of crystalline cellulose in growing pollen tubes. Sex. Plant Reprod. 23: 15–27 - PubMed
    1. Bartnicki-Garcia S. (2002). Hyphal tip growth: Outstanding questions. Molecular Biology of Fungal Development, Osiewacz H.D., ed (New York: Marcel Dekker; ), pp. 29–58
    1. Bartnicki-Garcia S., Bracker C.E., Gierz G., Lopez-Franco R., Lu H. (2000). Mapping the growth of fungal hyphae: Orthogonal cell wall expansion during tip growth and the role of turgor. Biophys. J. 79: 2382–2390 - PMC - PubMed
    1. Baskin T. (2005). Anisotropic expansion of the plant cell wall. Annu. Rev. Cell Dev. Biol. 21: 203–222 - PubMed
    1. Benkert R., Obermeyer G., Bentrup F.W. (1997). The turgor pressure of growing lily pollen tubes. Protoplasma 198: 1–8

Publication types

LinkOut - more resources