. 2010 Oct;154(2):833-46.
doi: 10.1104/pp.110.161646. Epub 2010 Aug 10.

The glabra1 mutation affects cuticle formation and plant responses to microbes

Affiliations

The glabra1 mutation affects cuticle formation and plant responses to microbes

Ye Xia et al. Plant Physiol. 2010 Oct.

Abstract

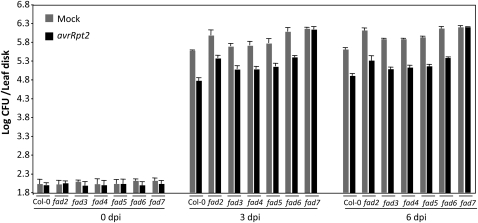
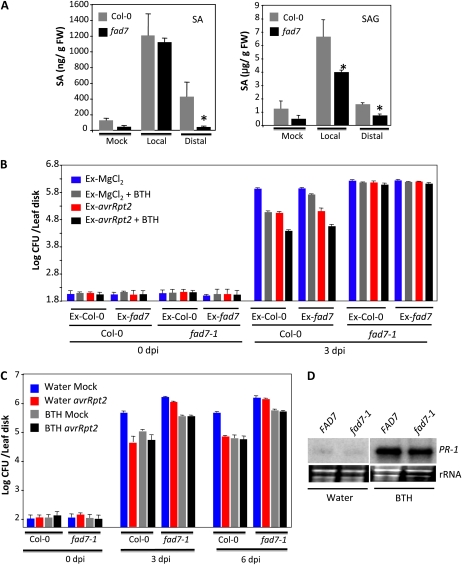
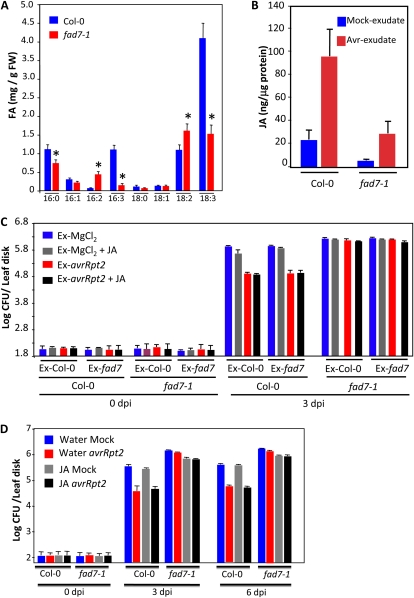
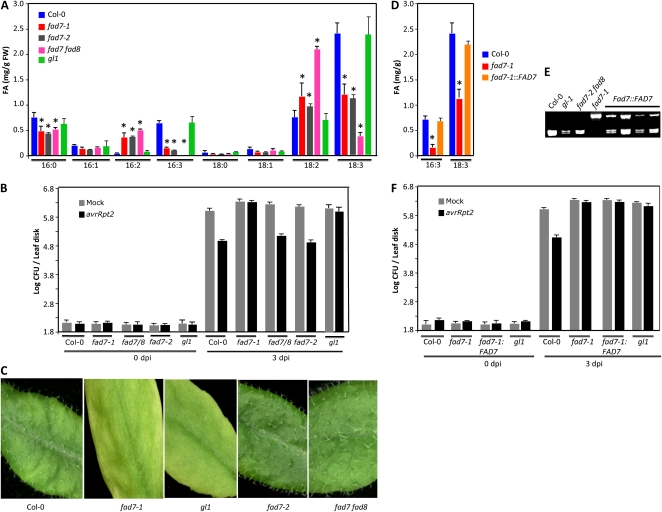
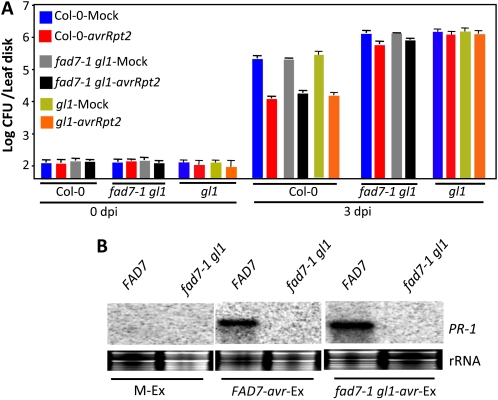
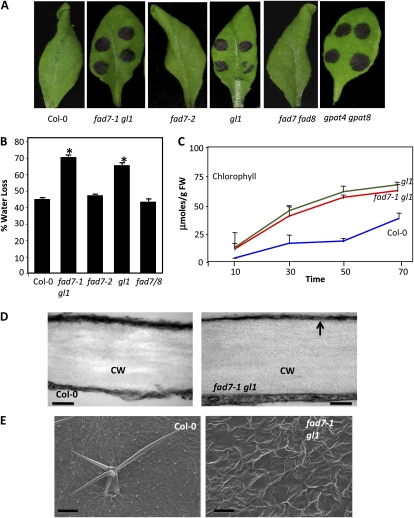
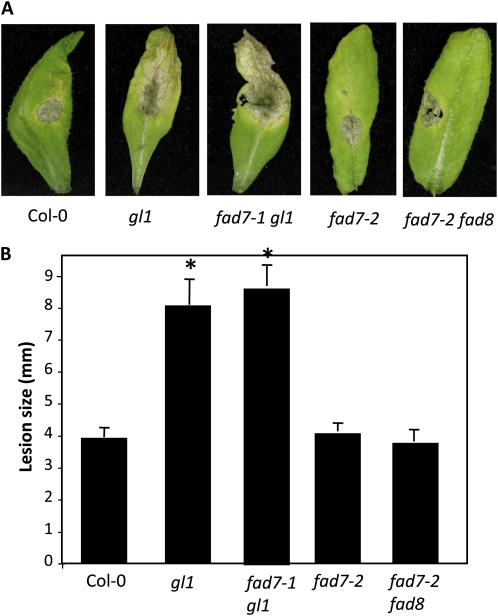
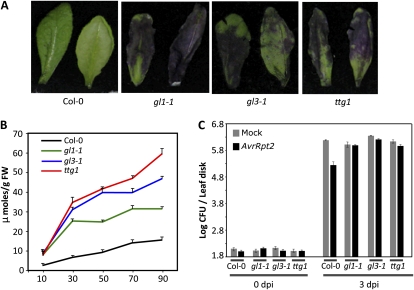
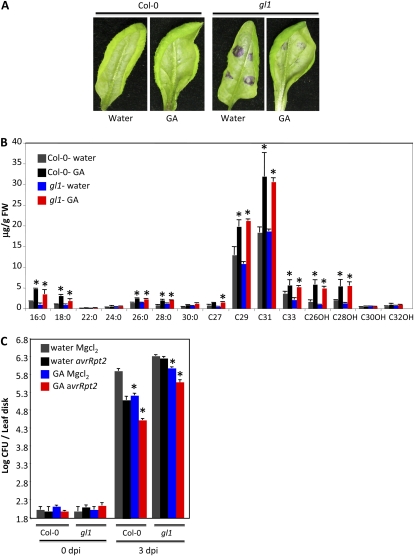
Systemic acquired resistance (SAR) is a form of defense that provides resistance against a broad spectrum of pathogens in plants. Previous work indicates a role for plastidial glycerolipid biosynthesis in SAR. Specifically, mutations in FATTY ACID DESATURASE7 (FAD7), which lead to reduced trienoic fatty acid levels and compromised plastidial lipid biosynthesis, have been associated with defective SAR. We show that the defective SAR in Arabidopsis (Arabidopsis thaliana) fad7-1 plants is not associated with a mutation in FAD7 but rather with a second-site mutation in GLABRA1 (GL1), a gene well known for its role in trichome formation. The compromised SAR in gl1 plants is associated with impairment in their cuticles. Furthermore, mutations in two other components of trichome development, GL3 and TRANSPARENT TESTA GLABRA1, also impaired cuticle development and SAR. This suggests an overlap in the biochemical pathways leading to cuticle and trichome development. Interestingly, exogenous application of gibberellic acid (GA) not only enhanced SAR in wild-type plants but also restored SAR in gl1 plants. In contrast to GA, the defense phytohoromes salicylic acid and jasmonic acid were unable to restore SAR in gl1 plants. GA application increased levels of cuticular components but not trichome formation on gl1 plants, thus implicating cuticle, but not trichomes, as an important component of SAR. Our findings question the prudence of using mutant backgrounds for genetic screens and underscore a need to reevaluate phenotypes previously studied in the gl1 background.


Figures

Figure 1.
Figure 1.
SAR response in fad mutants. Primary leaves were inoculated with MgCl2 (gray bars) or P. syringae expressing avrRpt2 (black bars), and the systemic leaves were inoculated 48 h later with a virulent strain of P. syringae.
Figure 2.
Figure 2.
SA levels and pathogen response of Col-0 and fad7-1 plants after exogenous application of BTH. A, SA and SAG levels in Col-0 and fad7-1 plants inoculated with MgCl2 or P. syringae expressing avrRpt2. FW, Fresh weight. B, SAR response in Col-0 and fad7-1 plants infiltrated with exudates collected from wild-type or fad7-1 plants that were treated either with MgCl2 or P. syringae expressing avrRpt2. Exudates (Ex) were mixed with water or 100 μm BTH prior to infiltration into a fresh set of plants. C, SAR in Col-0 or fad7-1 plants treated with water or BTH for 48 h prior to inoculation. D, RNA gel blot showing transcript levels of PR-1 gene in plants treated with water or BTH for 48 h. [See online article for color version of this figure.]
Figure 3.
Figure 3.
FA and JA levels and pathogen response of Col-0 and fad7-1 plants after exogenous application of JA. A, Levels of FAs in 4-week-old Col-0 and fad7-1 leaves. The error bars represent sd. Asterisks denote a significant difference with Col-0 (t test, P < 0.05). FW, Fresh weight. B, JA levels in Col-0 and fad7-1 plants inoculated with MgCl2 or P. syringae expressing avrRpt2. C, SAR response in Col-0 and fad7-1 plants infiltrated with exudates collected from wild-type or fad7-1 plants that were treated either with MgCl2 or P. syringae expressing avrRpt2. Exudates (Ex) were mixed with water or 50 μm JA prior to infiltration into a fresh set of plants. D, SAR in Col-0 or fad7-1 plants treated with water or JA for 48 h prior to inoculation. [See online article for color version of this figure.]
Figure 4.
Figure 4.
FA levels, SAR response, and trichome phenotypes in fad7 and fad7 fad8 plants. A, Levels of FAs in 4-week-old leaves. The error bars represent sd. Asterisks denote a significant difference with Col-0 (t test, P < 0.05). FW, Fresh weight. B, SAR response in the indicated genotypes. C, Leaves from the indicated genotypes showing the presence or absence of trichomes. D, Levels of FAs in the indicated genotypes. At least 10 different T2 transgenic plants expressing a genomic copy of FAD7 in the fad7-1 background were analyzed, and all showed a similar profile. The error bars represent sd. Asterisks denote a significant difference with Col-0 (t test, P < 0.05). E, Cleaved amplified polymorphic sequence analysis of the indicated genotypes for fad7-1 mutation. F, SAR response in the indicated genotypes. Two independent transgenic lines were analyzed, and both showed compromised SAR.
Figure 5.
Figure 5.
Responsiveness of gl1 plants to petiole exudates collected from pathogen-inoculated plants. A, SAR response in Col-0, fad7-1 gl1, and gl1 plants infiltrated with exudates collected from wild-type or acp4 plants that were treated either with MgCl2 or avrRpt2. B, RNA gel blot showing transcript levels of PR-1 in Col-0 and fad7-1 gl1 leaves infiltrated with petiole exudates (Ex). PR-1 transcript levels were analyzed 48 h after treatments. M and avr indicate petiole exudates collected from leaves infiltrated with MgCl2 or P. syringae containing avrRpt2. [See online article for color version of this figure.]
Figure 6.
Figure 6.
Evaluation of cuticle-associated phenotypes in fad7-1 gl1 plants. A, Toluidine blue-stained leaves from 4-week-old plants of the indicated genotypes. B, Measurement of water lost from leaves subjected to drought conditions for 4 d. C, A time-course measurement of chlorophyll leaching in the indicated genotypes. FW, Fresh weight. D, Transmission electron micrographs showing the cuticle layer on the adaxial surface of leaves from the indicated genotypes. The arrow indicates electron-opaque regions. CW, Cell wall. Bars = 50 nm. E, Scanning electron micrographs showing adaxial surface of leaves from the indicated genotypes. Bars = 200 μm. [See online article for color version of this figure.]
Figure 7.
Figure 7.
Response of gl1 to the hemibiotrophic pathogen C. higginsianum. A, Disease symptoms on the indicated genotypes spot inoculated with 106 spores mL−1 C. higginsianum. B, Lesion size in spot-inoculated genotypes. The plants were spot inoculated with 106 spores mL−1 C. higginsianum, and the lesion size was measured from 20 to 30 independent leaves at 6 dpi. Statistical significance was determined using Student’s t test. Asterisks indicate data significantly different from those of the control (Col-0; P < 0.05). Error bars indicate sd. [See online article for color version of this figure.]
Figure 8.
Figure 8.
Evaluation of cuticle-associated phenotypes and SAR response in gl3 and ttg1 plants. A, Toluidine blue-stained leaves from 4-week-old plants of the indicated genotypes. B, A time-course measurement of chlorophyll leaching in the indicated genotypes. FW, Fresh weight. C, SAR response in the indicated genotypes. [See online article for color version of this figure.]
Figure 9.
Figure 9.
Evaluation of cuticle-associated phenotypes and SAR response in plants treated with GA. A, Toluidine blue-stained leaves from 4-week-old plants of the indicated genotypes. B, Analysis of wax components from leaves of 4-week old Col-0 and gl1 plants treated with water or GA. 16:0 to 30:0 are FAs, C27 to C33 are alkanes, and C26OH to C32OH are primary alcohols. FW, Fresh weight. C, SAR response in Col-0 and gl1 plants pretreated with water or GA. Asterisks denote significant differences with respect to water-treated and MgCl2-infiltrated plants (t test, P < 0.05). [See online article for color version of this figure.]

References

    1. Aarts N, Metz M, Holub E, Staskawicz BJ, Daniels MJ, Parker JE. (1998) Different requirements for EDS1 and NDR1 by disease resistance genes define at least two R gene-mediated signaling pathways in Arabidopsis. Proc Natl Acad Sci USA 95: 10306–10311 - PMC - PubMed
    1. Achard P, Genschik P. (2009) Releasing the brakes of plant growth: how GAs shutdown DELLA proteins. J Exp Bot 60: 1085–1092 - PubMed
    1. Achard P, Renou JP, Berthome R, Harberd NP, Genschik P. (2008) Plant DELLAs restrain growth and promote survival of adversity by reducing the levels of reactive oxygen species. Curr Biol 18: 656–660 - PubMed
    1. Attaran E, Zeier TE, Griebel T, Zeier J. (2009) Methyl salicylate production and jasmonate signaling are not essential for systemic acquired resistance in Arabidopsis. Plant Cell 21: 954–971 - PMC - PubMed
    1. Barkan L, Vijayan P, Carlsson AS, Mekhedov S, Browse J. (2006) A suppressor of fab1 challenges hypotheses on the role of thylakoid unsaturation in photosynthetic function. Plant Physiol 141: 1012–1020 - PMC - PubMed

Publication types

MeSH terms

LinkOut - more resources