. 2010 Jul 19:4:43.
doi: 10.3389/fnins.2010.00043. eCollection 2010.

Imaging and recording subventricular zone progenitor cells in live tissue of postnatal mice

Affiliations

Imaging and recording subventricular zone progenitor cells in live tissue of postnatal mice

Benjamin Lacar et al. Front Neurosci. .

Abstract

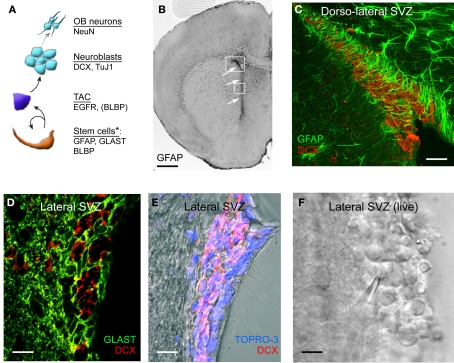
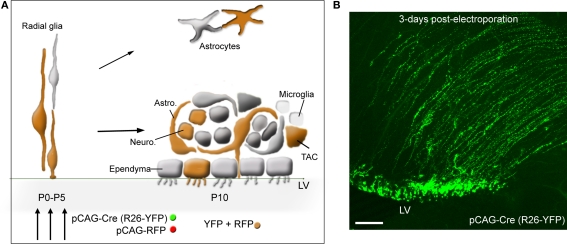
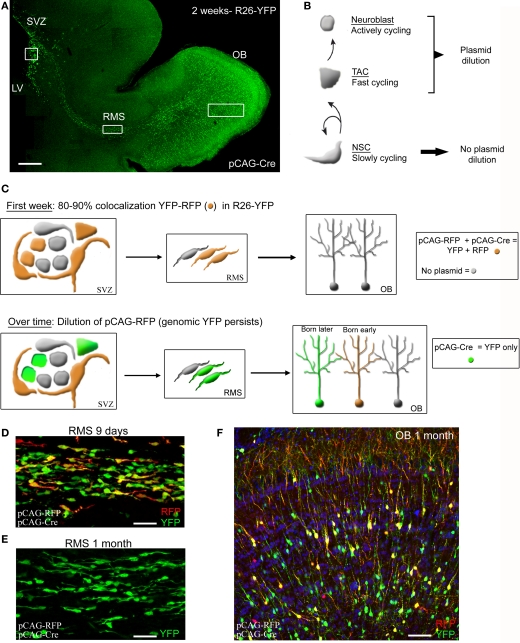
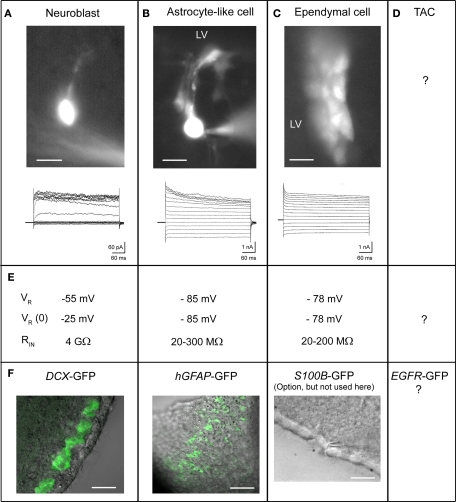
The subventricular zone (SVZ) is one of two regions where neurogenesis persists in the postnatal brain. The SVZ, located along the lateral ventricle, is the largest neurogenic zone in the brain that contains multiple cell populations including astrocyte-like cells and neuroblasts. Neuroblasts migrate in chains to the olfactory bulb where they differentiate into interneurons. Here, we discuss the experimental approaches to record the electrophysiology of these cells and image their migration and calcium activity in acute slices. Although these techniques were in place for studying glial cells and neurons in mature networks, the SVZ raises new challenges due to the unique properties of SVZ cells, the cellular diversity, and the architecture of the region. We emphasize different methods, such as the use of transgenic mice and in vivo electroporation that permit identification of the different SVZ cell populations for patch clamp recording or imaging. Electroporation also permits genetic labeling of cells using fluorescent reporter mice and modification of the system using either RNA interference technology or floxed mice. In this review, we aim to provide conceptual and technical details of the approaches to perform electrophysiological and imaging studies of SVZ cells.

Keywords: calcium imaging; electroporation; migration; neuroblasts; neurogenesis; proliferation; stem cells; transgenic mice.


Figures

Figure 1
Figure 1
SVZ cell lineage and antigenic properties. (A) Diagram illustrating the lineage and antigenic properties of the different SVZ progenitor cells. GFAP, glial fibrillary acidic protein; GLAST, glutamate-aspartate transporter; BLBP, brain lipid-binding protein; DCX, doublecortin; TuJ1, βIII-tubulin; TAC, transit-amplifying cells. Some, but not all, of the TACs express BLBP. (B) Photograph of GFAP immunostaining in a coronal section containing the SVZ. The arrows point to the SVZ. (C) Confocal image of GFAP (green) and DCX (red) co-immunostaining in the dorso-lateral SVZ. (D) Confocal image of GLAST (green) and DCX (red) co-immunostaining in the lateral SVZ located along the lateral ventricle (E) Confocal image of DCX (red) immunostaining and TOPRO-3 (nuclear labeling) in the lateral SVZ. (F) Image of a live coronal slice containing the lateral SVZ. The lateral ventricle is on the right and the striatum on the left. Scale bars: 500 μm (B), 100 μm (C), 60 μm (D) and (E), 40 μm (F). *Note that presumably all stem cells express these markers, but individual markers alone are not sufficient to identify stem cells.
Figure 2
Figure 2
SVZ electroporation and labeled cells. (A) Diagram illustrating: (1) the transformation of radial glia into SVZ astrocytes and ependymal cells, and parenchymal astrocytes during the first 2 weeks, (2) the cellular organization of the SVZ. Astrocyte-like cells (astro.) ensheath neuroblasts (neuro.). TACs and microglia (represented as small light cells) are scattered throughout the SVZ. Ependymal cells line the lateral ventricle (LV). (3) Co-electroporation of pCAG-driven fluorescent proteins results in protein expression into radial glia, and thus in SVZ astrocyte-like cells and ependymal cells, and the progeny of astrocyte-like cells, i.e., TAC and neuroblasts that appear orange due to both RFP and YFP co-localization. The diagram assumes a 100% co-localization, which is experimentally 80–90%. (B) Confocal image illustrating the expression of yellow fluorescent protein (YFP) in radial glia following electroporation of a pCAG-Cre in Rosa26-YFP mice. Scale bar: 100 μm.
Figure 3
Figure 3
Illustration of plasmid dilution post-electroporation cell but persistent labeling in Rosa mice. (A) Confocal reconstruction of a sagittal section from a 2-week-old R26-YFP mouse in which SVZ cells were electroporated at P0 with pCAG-Cre. (B) Diagram illustrating the SVC cell lineage and their plasmid dilution based on their cycling property. (C) Illustration of pCAG-RFP dilution over time occurring in neuroblasts and TACs but not in astrocyte-like cells. Neuroblasts and TACs become green only following pCAG-RFP dilution while astrocyte-like cells express RFP and YFP (orange). YFP is not diluted due to its genomic expression and as a result there will be an accumulation of YFP+ neurons in the OB over time. (D–F) Confocal images of the RMS at 9 days and 1 month ((D) and (E), respectively), and olfactory bulb (OB) at 4 weeks post-electroporation (F) with pCAG-Cre and pCAG-RFP in a Rosa26-Stop-YFP mouse. Scale bars: 200 μm (A), 50 μm (D) and (E).
Figure 4
Figure 4
Electrophysiological properties of SVZ cells. (A–D) Each column corresponds to the properties of the following cell type: neuroblasts (A), astrocyte-like cells (B), ependymal cells (C), and the uncharacterized TAC (D). Live image of Lucifer yellow-filled cells during patch clamp recording are shown for each. (E) Biophysical properties including resting potential VR, zero-current VR, and input resistance RIN of the different cell types. (F) Confocal images obtained from transgenic mice DCX-GFP (coronal section) and hGFAP-GFP (sagittal section), and phase image from wild-type mice (horizontal section). Scale bars: 10 μm (A, B), 20 μM (C), and in (F): 20 μm (DCX-GFP), 50 μm (hGFAP-GFP), 20 μm (phase image).
Figure 5
Figure 5
Loading protocol of calcium indicator dyes. (A, C, E) Diagram illustrating the loading protocol of a calcium indicator dye: by bath also called bulk loading (A), by pressure application on top of the tissue (C) or inside the tissue (E). RT, room temperature; deg, degree. (B, D, F) After a 30- to 45-min de-esterification time-period at room temperature (RT), loading cells progressively become fluorescent upon proper excitation as shown on confocal images on the right. Scale bar: 50 μm (B, D, F).
Figure 6
Figure 6
Calcium imaging with different dyes and in transgenic mice. (A–C) Confocal images displaying SVZ cells loaded with Fluo-4 AM (A), Oregon Green BAPTA-1 AM (OGB-1 AM) (B), Rhod-2 AM (C) with corresponding muscimol-induced calcium responses under each image. (D, E) Confocal images of SVZ cells before (D) and after (E) Fluo-4 AM loading in a sagittal section from a hGFAP-MrgA1:GFP mouse. (F–H) Zoomed images from the white box shown in (D) and (E), before (F) and during muscimol (G) or FLRFa (H) application. CC, corpus callosum; LV, lateral ventricle; Str, striatum. Scale bars: 30 μm (A–C), 30 μm (D, E), 15 μm (F–H).
Figure 7
Figure 7
Analysis of neuroblast migration in acute sagittal slices. (A, B) Schematic of a confocal Z-stacks spaced by 1–2 μm (A) are acquired every 5–15 min (B). (C) Off-line, the reconstructed movies are corrected for X–Y drift using MultiStackReg ImageJ Plugin (NIH ImageJ). (D) Cell tracking and migration analysis is performed using MTrackJ ImageJ Plugin.

Similar articles

Cited by

References

    1. Aguirre A., Gallo V. (2004). Postnatal neurogenesis and gliogenesis in the olfactory bulb from NG2-expressing progenitors of the subventricular zone. J. Neurosci. 24, 10530–1054110.1523/JNEUROSCI.3572-04.2004 - DOI - PMC - PubMed
    1. Aguirre A. A., Chittajallu R., Belachew S., Gallo V. (2004). NG2-expressing cells in the subventricular zone are type C-like cells and contribute to interneuron generation in the postnatal hippocampus. J. Cell Biol. 165, 575–58910.1083/jcb.200311141 - DOI - PMC - PubMed
    1. Akli S., Caillaud C., Vigne E., Stratford-Perricaudet L. D., Poenaru L., Perricaudet M., Kahn A., Peschanski M. R. (1993). Transfer of a foreign gene into the brain using adenovirus vectors. Nat. Genet. 3, 224–22810.1038/ng0393-224 - DOI - PubMed
    1. Altman J. (1963). Autoradiographic investigation of cell proliferation in the brains of rats and cats. Anat. Rec. 145, 573–59110.1002/ar.1091450409 - DOI - PubMed
    1. Altman J. (1969). Autoradiographic and histological studies of postnatal neurogenesis. IV. Cell proliferation and migration in the anterior forebrain, with special reference to persisting neurogenesis in the olfactory bulb. J. Comp. Neurol. 137, 433–45710.1002/cne.901370404 - DOI - PubMed

LinkOut - more resources