

Electrophysiological characteristics of globus pallidus neurons
- PMID: 20700458
- PMCID: PMC2917366
- DOI: 10.1371/journal.pone.0012001
Electrophysiological characteristics of globus pallidus neurons
Abstract
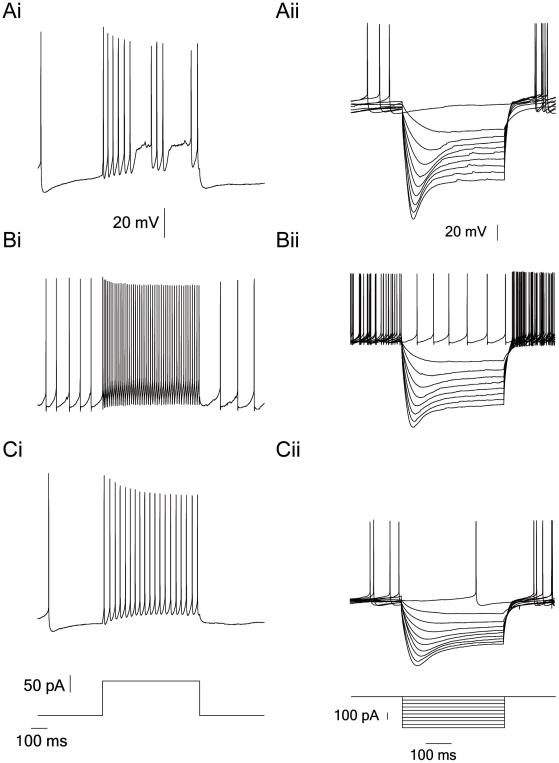
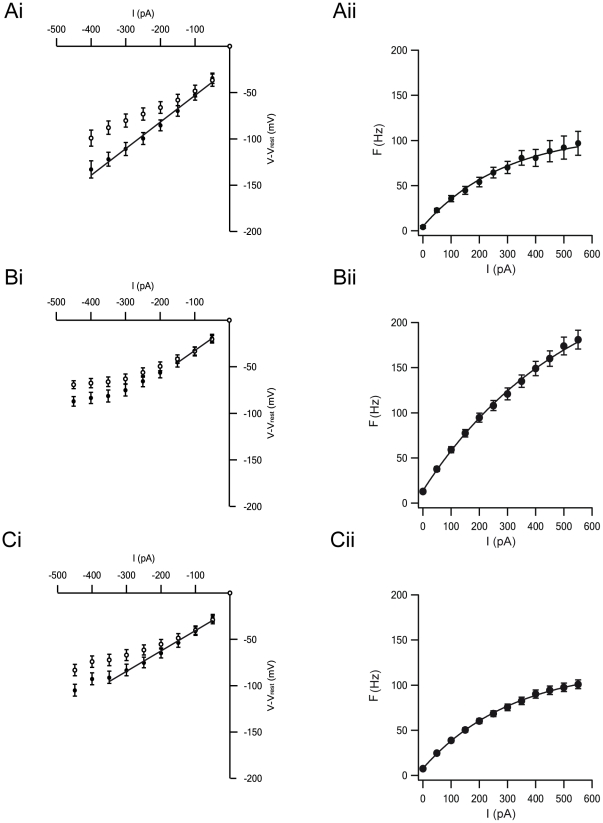
Extracellular recordings in primates have identified two types of neurons in the external segment of the globus pallidus (GPE): high frequency pausers (HFP) and low frequency bursters (LFB). The aim of the current study was to test whether the properties of HFP and LFB neurons recorded extracellularly in the primate GPe are linked to cellular mechanisms underlying the generation of action potential (AP) firing. Thus, we recorded from primate and rat globus pallidus neurons. Extracellular recordings in primates revealed that in addition to differences in firing patterns the APs of neurons in these two groups have different widths (APex). To quantitatively investigate this difference and to explore the heterogeneity of pallidal neurons we carried out cell-attached and whole-cell recordings from acute slices of the rat globus pallidus (GP, the rodent homolog of the primate GPe), examining both spontaneous and evoked activity. Several parameters related to the extracellular activity were extracted in order to subdivide the population of recorded GP neurons into groups. Statistical analysis showed that the GP neurons in the rodents may be differentiated along six cellular parameters into three subgroups. Combining two of these groups allowed a better separation of the population along nine parameters. Four of these parameters (Fmax, APamp, APhw, and AHPs amplitude) form a subset, suggesting that one group of neurons may generate APs at significantly higher frequencies than the other group. This may suggest that the differences between the HFP and LFB neurons in the primate are related to fundamental underlying differences in their cellular properties.
Conflict of interest statement
Figures


Similar articles
-
Globus Pallidus external segment neuron classification in freely moving rats: a comparison to primates.PLoS One. 2012;7(9):e45421. doi: 10.1371/journal.pone.0045421. Epub 2012 Sep 21. PLoS One. 2012. PMID: 23028997 Free PMC article.
-
Statistical properties of pauses of the high-frequency discharge neurons in the external segment of the globus pallidus.J Neurosci. 2007 Mar 7;27(10):2525-38. doi: 10.1523/JNEUROSCI.4156-06.2007. J Neurosci. 2007. PMID: 17344390 Free PMC article.
-
Periodic unitary synaptic currents in the mouse globus pallidus during spontaneous firing in slices.J Neurophysiol. 2021 Apr 1;125(4):1482-1500. doi: 10.1152/jn.00071.2021. Epub 2021 Mar 17. J Neurophysiol. 2021. PMID: 33729831 Free PMC article.
-
Orexin-A increases the activity of globus pallidus neurons in both normal and parkinsonian rats.Eur J Neurosci. 2016 Sep;44(5):2247-57. doi: 10.1111/ejn.13323. Epub 2016 Jul 13. Eur J Neurosci. 2016. PMID: 27336845
-
Single-axon tracing study of neurons of the external segment of the globus pallidus in primate.J Comp Neurol. 2000 Jan 31;417(1):17-31. J Comp Neurol. 2000. PMID: 10660885
Cited by
-
Simulating the effects of short-term synaptic plasticity on postsynaptic dynamics in the globus pallidus.Front Syst Neurosci. 2013 Aug 8;7:40. doi: 10.3389/fnsys.2013.00040. eCollection 2013. Front Syst Neurosci. 2013. PMID: 23964207 Free PMC article.
-
Continuous modulation of action potential firing by a unitary GABAergic connection in the globus pallidus in vitro.J Neurosci. 2013 Jul 31;33(31):12805-9. doi: 10.1523/JNEUROSCI.1970-13.2013. J Neurosci. 2013. PMID: 23904615 Free PMC article.
-
A Multi-Scale Computational Model of Levodopa-Induced Toxicity in Parkinson's Disease.Front Neurosci. 2022 Apr 19;16:797127. doi: 10.3389/fnins.2022.797127. eCollection 2022. Front Neurosci. 2022. PMID: 35516806 Free PMC article.
-
Firing rate and pattern heterogeneity in the globus pallidus arise from a single neuronal population.J Neurophysiol. 2013 Jan;109(2):497-506. doi: 10.1152/jn.00677.2012. Epub 2012 Oct 31. J Neurophysiol. 2013. PMID: 23114208 Free PMC article.
-
Intrinsic timescales across the basal ganglia.Sci Rep. 2021 Nov 1;11(1):21395. doi: 10.1038/s41598-021-00512-2. Sci Rep. 2021. PMID: 34725371 Free PMC article.
References
-
- Albin RL, Young AB, Penney JB. The functional anatomy of basal ganglia disorders. Trends Neurosci. 1989;12:366–375. - PubMed
-
- Alexander GE, Crutcher MD. Functional architecture of basal ganglia circuits: neural substrates of parallel processing. Trends Neurosci. 1990;13:266–271. - PubMed
-
- DeLong MR. Activity of pallidal neurons during movement. J Neurophysiol. 1971;34:414–427. - PubMed
-
- Gerfen CR, Wilson CJ. Swanson LW, Bjorklund A, Hokfelt T, editors. The basal ganglia. 1996. pp. 371–468. Handbook of Chemical Neuroanatomy, Vol 12: Integrated Systems of the CNS, Part III: Elsevier Science.
-
- Kita H. Globus pallidus external segment. Prog Brain Res. 2007;160:111–133. - PubMed
Publication types
MeSH terms
LinkOut - more resources
Full Text Sources
Miscellaneous
