. 2010 Aug 5;5(8):e12015.
doi: 10.1371/journal.pone.0012015.

EPO receptor gain-of-function causes hereditary polycythemia, alters CD34 cell differentiation and increases circulating endothelial precursors

Affiliations

EPO receptor gain-of-function causes hereditary polycythemia, alters CD34 cell differentiation and increases circulating endothelial precursors

Silverio Perrotta et al. PLoS One. .

Retraction in

Abstract

Background: Gain-of-function of erythropoietin receptor (EPOR) mutations represent the major cause of primary hereditary polycythemia. EPOR is also found in non-erythroid tissues, although its physiological role is still undefined.

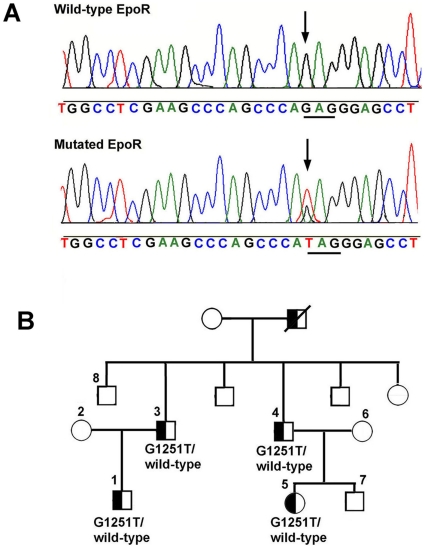
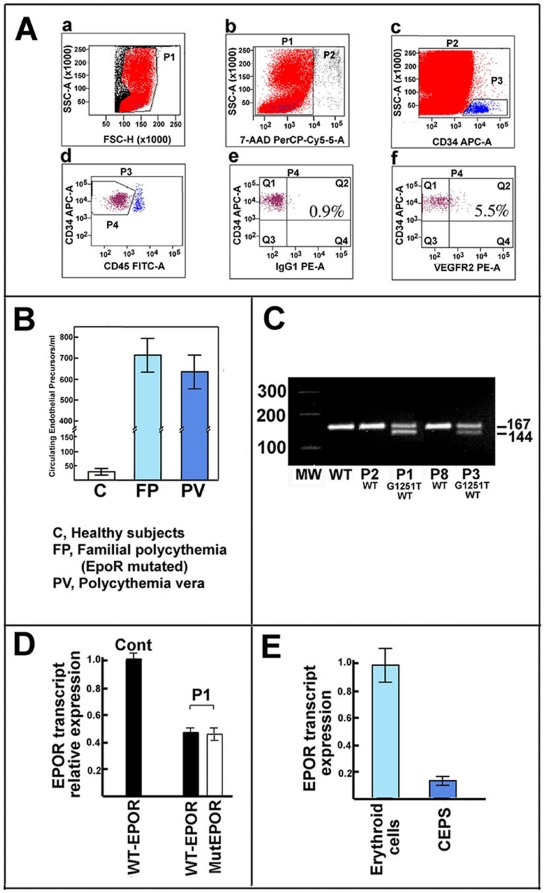
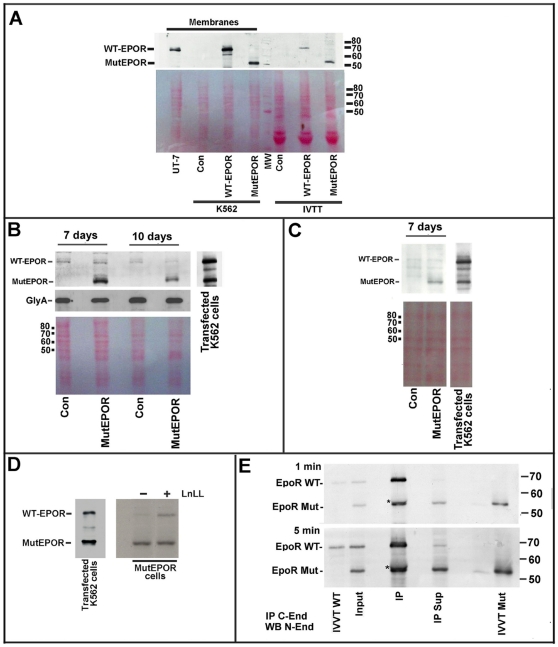
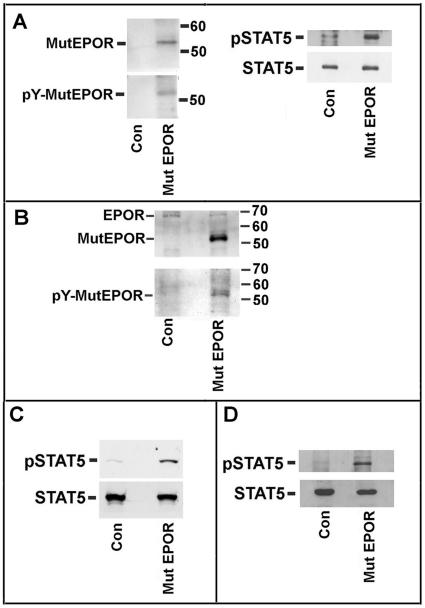
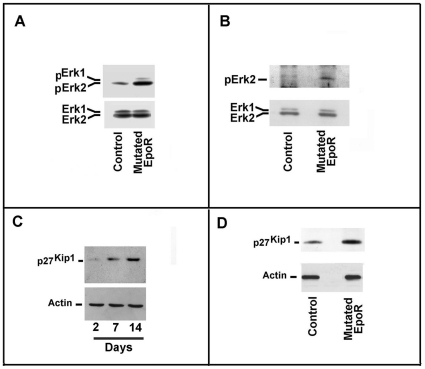
Methodology/principal findings: We describe a family with polycythemia due to a heterozygous mutation of the EPOR gene that causes a G-->T change at nucleotide 1251 of exon 8. The novel EPOR G1251T mutation results in the replacement of a glutamate residue by a stop codon at amino acid 393. Differently from polycythemia vera, EPOR G1251T CD34(+) cells proliferate and differentiate towards the erythroid phenotype in the presence of minimal amounts of EPO. Moreover, the affected individuals show a 20-fold increase of circulating endothelial precursors. The analysis of erythroid precursor membranes demonstrates a heretofore undescribed accumulation of the truncated EPOR, probably due to the absence of residues involved in the EPO-dependent receptor internalization and degradation. Mutated receptor expression in EPOR-negative cells results in EPOR and Stat5 phosphorylation. Moreover, patient erythroid precursors present an increased activation of EPOR and its effectors, including Stat5 and Erk1/2 pathway.

Conclusions/significance: Our data provide an unanticipated mechanism for autosomal dominant inherited polycythemia due to a heterozygous EPOR mutation and suggest a regulatory role of EPO/EPOR pathway in human circulating endothelial precursors homeostasis.


Conflict of interest statement

Competing Interests: The authors have declared that no competing interests exist.

Figures

Figure 1
Figure 1. EPOR mutation and pedigree of the polycythemic family.
Panel A. The panel shows nucleotides 1242–1270 (exon 8) of the EPOR gene. A heterozygous G1251 T mutation was detected in the propositus P1. The same mutation was verified in all the subjects affected by erythrocytosis (P1, P3, P4, and P5). Panel B. Pedigree of the family with dominant familial erythrocytosis is shown. Squares represent males, circles represent females, and Ps represent the subjects that were genotyped. P1, P3, P4, and P5 are the subjects affected by congenital polycythemia.
Figure 2
Figure 2. Phenotypical features of erythroid precursors and CD34+cells from the affected patients.
Panel A. Growth curve of blood erythroid precursors from the the four EPOR G1251T subjects, three subjects affected by PV (JAK2 V617F homozygotes), and three healthy subjects. Erythroid precursors were grown from peripheral mononuclear cells as described (Migliaccio et al., 2002) without adding recombinant EPO. The estimated concentration of EPO in the growth medium was about 0.4 mU/mL. Data represent mean ± SEM (n = 3 per cell type), and are representative of 3 experiments. Panel B. The graphic reports the percentage of BFU-E cells (evaluated by glycophorin A expression after 14 days growth) in liquid cultures of erythroid precursors from the P1 patient and two PV patients (JAK2 V617F homozygotes). The cells were cultured in the absence of exogenously added EPO. Data represent mean ± SEM (n = 3 per cell type), and are representative of 2 experiments. Panel C. Fluorescent activated cell scanner (FACS) analysis of liquid cultures of peripheral purified CD34+ cells grown for 14 days in with minimal EPO. The erythroid precursors were prepared from the P1 subject and from a patient affected by PV associated with a classical JAK2 mutation (JAK2 V617F homozygote). GlyA+ means glycophorin A positive cells. The results are representative of three independent experiments that gave superimposable results. Panel D. FACS analysis of samples shown in panel C. The panel reports the analysis of GlyA levels in cells plotted versus forward scatter. Panel E. Peripheral CD34+ cells were growth on soft agar in the absence of EPO. The images report the features of colonies from the P1 subject (b, d) or from a subject affected by PV (JAK2 V617F homozygote) (a, c). The results are representative of four independent experiments that gave superimposable results.
Figure 3
Figure 3. Analysis of circulating endothelial precursors from polycythemic patients.
Panel A. Evaluation of circulating endothelial progenitor cells by cell phenotype. The panel reports the flow cytometric analysis of circulating endothelial precursors from patient P1, a) shows the gate made to eliminate platelets and cell debris; b) reports the gate for eliminating apoptotic/necrotic cells (7-AAD positive); c) shows the gate for enumerating CD34+ cells; d) indicates the gate made to enumerate CD34+ and CD45neg/dim cells; e) reports the negative control; and f) is the final gate enumerating CD45neg/dim, CD34+, and VEGFR2+ circulating endothelial precursors. The results are representative of several (>10) independent experiments that gave superimposable results. Panel B. The panel shows the number of circulating endothelial precursors of normal subjects, the four EPOR G1251T patients, and three subjects affected by PV. The results represent the mean (bar, SD) of 4 independent evaluations (each performed in duplicate) of the subjects analyzed. Panel C. The panel reports a semiquantitative evaluation of the expression of EPOR alleles in erythroid precursors from subjects of the family investigated. Total RNA was prepared from erythroid precursors after 7 days of growth (in the presence of 3 U/mL EPO) and retrotranscribed to cDNA. Then, PCR was performed employing primers specific for the two alleles (ie the wild-type and mutated). The antisense primer of the mutated allele inserted a restriction site for NdeI in the amplified product that allowed distinction between the normal and mutated allele. After the PCR reaction, the mixtures were digested with the Ndel enzyme. The 167 bp product is derived from the wild-type transcript while the 144 bp product is from the mutated EpoR mRNA form. The figure is representative of 5 experiments. Panel D. Total RNA (see panel C) was employed to evaluate the content of EPOR alleles (wild type and EPOR G1251T) by realtime PCR. Expression was normalized to beta-actin and expressed as a percentage of wild type EPOR RNA from a control subject. Each bar represents the mean value ±SD. The figure is representative of 4 experiments. Additional details are reported in the text. Panel E. Total RNA were prepared from CD34+ cells (grown 7 days in the presence of EPO) and circulating endothelial precursors. Then, RNA was employed to evaluate the content of EPOR transcript by realtime PCR. Expression was normalized to beta-actin and expressed as a percentage of wild type EPOR RNA from CD34+ cells Each bar represents the mean value ±SD. The figure is representative of 5 experiments.
Figure 4
Figure 4. Analyses of EPOR protein in erythroid precursors.
Panel A. Western blot analysis of cellular membranes from the following samples (from the left to right): i) UT-7 cells; ii) untransfected K562 cells (Con); iii) wild-type EPOR transfected K562 cells (WT-EPOR); iv) mutated EPOR transfected K562 cells (MutEPOR); v) in vitro transcription/translation (IVTT) control mixture; vi) in vitro transcribed and translated wild-type EPOR, and vii) in vitro transcribed and translated mutated EPOR. K562 cells were transfected employing pMT21 plasmids encoding wild-type or mutated EPOR, while pcDNA3.1 plasmids were employed in the IVTT experiments. UT-7 cells were employed since these cells contain abundant amounts of wild-type EPOR (Della Ragione et al., 2007). Immunoblotting was performed with the antiserum against the N-end of EPOR. The bottom image is the filter, before immunoblotting, and colored with Red Ponceau. The image confirms equal loading of membrane proteins (lanes 2,3 and 4) and IVTT assay mixtures (lanes 6, 7 and 8). The immunoblotting is representative of 4 experiments. Panel B. The image on the left reports the immunoblotting analysis of membranes from the following samples (from left to right): I) peripheral CD34+ cells from a healthy subject (Con) grown for 7 days with EPO (3 U/mL); ii) peripheral CD34+ cells from patient P1 (MutEPOR) growth for 7 days with EPO (3 U/mL); iii) peripheral CD34+ cells from a healthy subject (Con) grown for 10 days with EPO (3 U/mL); and iv) peripheral CD34+ cells from patient P1 (MutEPOR) grown for 14 days with EPO. The immunoblotting on the right reports cell membranes from K562 cells cotransfected with the wild-type and mutated EPOR pMT21 plasmids as standard for the two EPOR forms. The immunoblotting was performed with the antiserum against the N-end of EpoR. The filter was also re-analyzed by antibodies against glucophorin A (immunoblotting at the center). The bottom image was taken to the filter colored with Red Ponceau before immunoblotting. The image confirms the equal loading of membrane proteins. The image is of 3 experiments. Panel C. The image on the left reports the immunoblotting analysis of membranes from the following samples (from left to right): i) peripheral CD34+ cells from a healthy subject (Con) cultured for 7 days without minimal EPO (0.4 mU/mL); ii) peripheral CD34+ cells from patient P1 (MutEPOR) cultured for 7 days without EPO. The immunoblotting at the right reports cell membranes from K562 cells cotransfected with both the wild-type and mutated EPOR pMT21 plasmids. The immunoblotting was performed using the antiserum against the N-end of EPOR. The bottom image was taken to the filter colored with Red Ponceau before immunoblotting. The image confirms the equal loading of membrane proteins. The immuniblotting is representative of 3 experiments. Panel D. Peripheral CD34+ cells from patient P1 were cultured for 7 days with EPO. Then, the cells were added with (or without) 50 µM LLnL for 4 hours. Finally, cell membranes were prepared and analyzed fot EPOR content. The immunoblotting was performed with the antiserum against the N-end of EpoR. The immunoblotting on the left reports cell membranes from K562 cells cotransfected with the wild-type and mutated EPOR pMT21 plasmids as standard for the two EPOR forms. Panel E. K562 cells were cotransfected with the wild-type and mutated forms of EPOR. Then, K562 cell membranes (Input) were immunoprecipitated with an antiserum directed against the EPOR C-end (IP C-end). Finally, the immunoprecipitated materials (IP) and the supernatant (IP Sup) of the reaction were analyzed with the antiserum directed against the EPOR N-terminus (WB N-end). The blot reports the following samples (from the left): i) IVTT wild-type EPOR; ii) membranes from cotransfected K562 cells (Input); iii) the immunoprecipitated materials (IP); iv) the supernatant of the immunoprecipitation (IP Sup); v) IVTT reaction of mutated EPOR. Note that the asterisk represents the signal due to the heavy chain of antibodies employed in the immunoprecipitation. The signal is immediately up to the band of the truncated receptor. Two different times of exposition are reported (1 minute and 5 minutes) to demonstrate the difference in the ratio of wild type/mutated forms in the input and in the supernatant. The input sample is 1/4 of the supernatant sample. The immunoblotting is representative of 3 experiments.
Figure 5
Figure 5. EPOR phosphorylation and STAT5 activation in erythroid cells expressing wild type or mutated EPOR.
Panel A. K562 cells were transfected with the mutated form of EPOR. After 3 days of growth in the absence of exogenously added EPO, K562 cell membranes and total cell extracts were prepared. (On the left) The membranes were analyzed with antibodies against EPOR N-end or against phosphotyrosine. A phosphotyrosine signal occurs only in the transfected cells and at the molecular weight of the mutated EPOR signal. (On the right) Cell extracts was analyzed for STAT5 and phosphoSTAT5 levels by means of specific antibodies. The immunoblotting is representative of 3 experiments. Panel B. Purified CD34+ cells from a control and P1 subject were grown for 7 days in the presence of EPO. Then, cell membranes were prepared and EPOR content and phosphorylated form were evaluated as in panel A. The immunoblotting is representative of 3 experiments. The data are are representative of 3 experiments. Panel C. Purified CD34+ cells from a control and P1 subject were grown for 7 days in the presence of EPO. Then, cell extracts were prepared and STAT5 and its phosphorylated form were analyzed as in panel A. The data are are representative of 3 experiments. Panel D. Purified CD34+ cells from a control and P1 subject were grown for 7 days in minimal EPO (0.4 mU/mL). Then cell extracts were prepared and STAT5 and phosphorylated fprm were analyzed as in panel A. Note: We were unable to evidentiate the phosphorylation of mutated EPOR in CD34+ cells grown in minimal EPO. This was probably due to the scarce amount of material available. However, differences in STAT5 activation between the control cells and cells from the patient were evident in panel D.
Figure 6
Figure 6. Transduction pathway status of erythroid precursors.
Panel A. Cytosolic extracts of CD34+ cells, cultured for 7 days in the presence of EPO, were prepared from a healthy subject and patient P1. Then, samples were analyzed for Erk1/2 and phospho Erk1/2 content. Panel B. Cytosolic extracts of of CD34+ cells, cultured for 7 days in the absence of exogenously added EPO (0.4 mU/mL EPO), were prepared from a healthy subject and patient P1. Then the samples were analyzed for Erk1/2 and phospho Erk1/2 content. Panel C. CD34+ cells from a healthy subject were grown for up to 14 days in the presence of EPO. Aliquots of cells at days 0, 7, and 14 were removed and cell extracts were prepared. Then, the samples were analyzed for p27Kip1 content by immunoblotting. Panel D. CD34+ cells from a healthy subject and patient P1 were grown for 7 days in the presence of EPO and cellular extracts were prepared. Then, samples were analyzed for p27Kip1 content.

Similar articles

Cited by

References

    1. Barber DL, D'Andrea AD. The erythropoietin receptor and the molecular basis of signal transduction. Semin Hematol. 1992;29:293–304. - PubMed
    1. Huang LJ, Shen Y-M, Bulut GB. Advances in understanding the pathogenesis of primary familial and congenital polycythemia, Brit J Haematol. 2010;148:844–852. - PMC - PubMed
    1. Feng J, Witthuhn BA, Matsuda T, Kohlhuber F, Kerr IM, et al. Activation of Jak2 catalytic activity requires phosphorylation of Y1007 in the kinase activation loop. Mol Cell Biol. 1997;17:2497–2501. - PMC - PubMed
    1. Longmore GD. A unique role for Stat5 in recovery from acute anemia. J Clin Inv. 2006;116:626–628. - PMC - PubMed
    1. Pelletier S, Gingras S, Funakoshi-Tago M, Howell S, Ihle JN. Two domains in the erythropoietin receptor are sufficient for Jak2 binding/activation and function. Mol Cell Biol. 2006;26:8527–8538. - PMC - PubMed

Publication types

MeSH terms