. 2010 Aug 5;6(8):e1000873.
doi: 10.1371/journal.pcbi.1000873.

Evolution of gene regulatory networks by fluctuating selection and intrinsic constraints

Affiliations

Evolution of gene regulatory networks by fluctuating selection and intrinsic constraints

Masaki E Tsuda et al. PLoS Comput Biol. .

Abstract

Various characteristics of complex gene regulatory networks (GRNs) have been discovered during the last decade, e.g., redundancy, exponential indegree distributions, scale-free outdegree distributions, mutational robustness, and evolvability. Although progress has been made in this field, it is not well understood whether these characteristics are the direct products of selection or those of other evolutionary forces such as mutational biases and biophysical constraints. To elucidate the causal factors that promoted the evolution of complex GRNs, we examined the effect of fluctuating environmental selection and some intrinsic constraining factors on GRN evolution by using an individual-based model. We found that the evolution of complex GRNs is remarkably promoted by fixation of beneficial gene duplications under unpredictably fluctuating environmental conditions and that some internal factors inherent in organisms, such as mutational bias, gene expression costs, and constraints on expression dynamics, are also important for the evolution of GRNs. The results indicate that various biological properties observed in GRNs could evolve as a result of not only adaptation to unpredictable environmental changes but also non-adaptive processes owing to the properties of the organisms themselves. Our study emphasizes that evolutionary models considering such intrinsic constraining factors should be used as null models to analyze the effect of selection on GRN evolution.


Conflict of interest statement

The authors have declared that no competing interests exist.

Figures

Figure 1
Figure 1. Schematic representation of the model.
(A) Each gene has a cis-regulatory region composed of 100 cis-sites (boxes; potential transcription factor binding sites) and a coding region (diamonds) from which products (circles) of the genes are created. The products of regulatory genes would bind to the corresponding binding sites (represented by the same colors) and control the expression of the target genes. A cis-regulatory region is allowed to have multiple binding sites for the same transcription factor; thus, the strength of regulatory interactions, including activation (red arrows) and repression (blue arrows), depend on the numbers and properties of the binding sites. The regulatory cascade would start by imposing an input signal that activates the R 1 gene. The phenotype of an individual is defined as the steady-state expression level of phenotypic genes. Core genes are expressed and actually involved in phenotypic expression. On the other hand, pseudo-expression genes are expressed but not involved in phenotypic expression. (B) The fitness of an individual depends on the cost of gene expression and the phenotypic suitability to the environment. The phenotypic suitability to the environment depends on the Euclidian distance between the individual phenotype and the optimum phenotype. The position of the optimum shifts a constant distance away (d) at every certain generation (f−1) in a random direction (random-walk) or to a fixed position (cyclic).
Figure 2
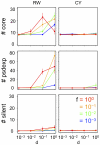
Figure 2. GRN structures that evolved under various fluctuations of phenotypic selection.
The number of core genes (#core), pseudo-expression genes (#psdexp), and silent genes (#silent) in GRNs that evolved for 50,000 generations under random-walk optimum shift (RW), and those that evolved under cyclic optimum shift (CY). All parameters were set at standard values (Table 1). Each point connected by solid lines represents the mean number of each type of genes in evolved GRNs under each selective condition. Vertical bars attached to the point represent 95% confidence intervals. d and f represent the amplitude and frequency of the optimum shift, respectively.
Figure 3
Figure 3. Relationship between the time-averaged fitness of a population and the GRN structures.
(A) An example of the changes of the mean fitness in a population during evolution. Red line indicates the mean fitness of a population at certain generation. Horizontal dotted line indicates the time-averaged fitness (F′) during the evolution in this population. (B) The time-averaged fitness of GRNs that evolved under various fluctuations of phenotypic selection. (C) The relationship between the time-averaged fitness and the structure of GRNs. Red line indicates the fitting curve to the quintic equation by non-linear least square method.
Figure 4
Figure 4. Relationship between the number of core genes in GRNs and the phenotypic effects of various types of mutations in core genes.
Points represent the results of each population evolved under various amplitudes (d) and frequencies (f) of random-walk optimum shift. Horizontal axes indicate the number of core genes in a population. Panels in each column indicate the effect of different types of mutations (basal transcription level mutation, BTL; cis-regulatory mutation, CIS; trans-regulatory mutation, TRA; gene deletion, DEL; gene duplication, DUP). PL, PN, and PS show the proportion of mutations that cause Loss-of-phenotype, those that have no phenotypic change (Non-effect), and those that have a Significant phenotypic change, respectively (PL + PN + PS = 1). DS shows the size of phenotypic changes caused by Significant mutations (the Euclidean distance between the original and mutant phenotypes). Statistical significance of the correlation was analyzed by Kendall's correlation test.
Figure 5
Figure 5. Relationship between the intensity of the optimum fluctuation and the fitness effect of various types of mutations during evolution.
Points represent the results of a population that evolved under various conditions of random-walk optimum shift. Horizontal axes indicate the time-averaged fitness of a population. Panels in each column indicate the effect of different types of mutations (same as Figure 4). Nt indicates the total number of mutations that arose during the evolution for each types of mutations. P indicates the proportions of mutations that have beneficial (red), neutral (blue), and deleterious (black) effects, respectively.
Figure 6
Figure 6. Relationship between the intensity of the optimum fluctuation and the fitness effects of gene duplication and gene deletion during evolution.
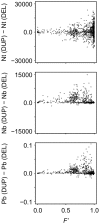
Points represent the results of a population that evolved under various conditions of random-walk optimum shift. Nt(x), Nb(x) and Pb(x) indicate the total number of mutations, number of beneficial mutations, and the proportions of beneficial mutations that arose during the evolution for mutation type x, respectively. Vertical axes indicate the difference in the number and the proportions of beneficial mutations between gene duplications and gene deletions. Horizontal axes indicate the time-averaged fitness of a population (F′).
Figure 7
Figure 7. Relationship between the number of core genes after evolution and the number of beneficial gene duplications and gene deletions.
Points represent the results of a population that evolved under various conditions of random-walk optimum shift. Vertical axes indicate the number of core genes. Nt(x), Nb(x) and Pb(x) indicate the total number of mutations, the number of beneficial mutations, and the proportions of beneficial mutations that arose during the evolution for mutation type x, respectively. Horizontal axes indicate the difference in the number and the proportions of beneficial mutations between gene duplications and gene deletions. Statistical significance of the correlation was analyzed by the Kendall's correlation test.
Figure 8
Figure 8. Effect of the strength of steady-state constraints on GRN evolution.
Greater values of V indicate weaker constraints on steady-state expression (V = 10−4, standard parameter value). Points connected by solid lines represent the mean number of core genes (#core), pseudo-expression genes (#psdexp), silent genes (#silent) and the time-averaged fitness (F′) in populations that evolved for 50,000 generations under each simulation condition. Vertical bars indicate 95% confidence intervals. Different colors indicate different conditions of phenotypic selection: d = 10−1, f = 10−1 (red); d = 100, f = 10−3 (blue); d = 10−3, f = 10−3 (black) under random-walk optimum shift.
Figure 9
Figure 9. Effect of gene expression costs on GRN evolution.
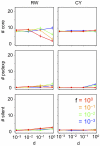
Greater values of c indicate the larger fitness load of a unit of gene expression (c = 10−5, standard parameter value). Points connected by solid lines represent the mean number of core genes (#core), pseudo-expression genes (#psdexp), silent genes (#silent) and the time-averaged fitness (F′) in populations that evolved for 50,000 generations under each simulation condition. Vertical bars indicate 95% confidence intervals. Different colors indicate different conditions of phenotypic selection: d = 10−1, f = 10−1 (red); d = 100, f = 10−3 (blue); d = 10−3, f = 10−3 (black) under random-walk optimum shift.
Figure 10
Figure 10. Effects of the probability of binding site formation by regulatory mutations (Cmut) on GRN evolution.
Greater values of Cmut indicate larger probabilities of binding site formation by regulatory mutation (Cmut = 10−2, standard parameter values). To control the Cmut value, the size of the cis-regulatory region of a gene (L) was varied; L = 10, 30, 100, 303, and 1000 for Cmut = 10−3, 3×10⁻³, 10−2, 3×10⁻², and 10−1, respectively. Points connected by solid lines represent the mean number of core genes (#core), pseudo-expression genes (#psdexp), silent genes (#silent) and the time-averaged fitness (F′) in populations that evolved for 50,000 generations under each simulation condition. Vertical bars indicate 95% confidence intervals. Different colors indicate different conditions of phenotypic selection; d = 10−1, f = 10−1 (red); d = 100, f = 10−3 (blue); d = 10−3, f = 10−3 (black) under random-walk optimum shift.
Figure 11
Figure 11. Indegree distribution of the assembled GRNs that evolved under various Cmut levels.
Horizontal and vertical axes in each panel show the indegree (the number of regulatory interactions that arrived at a gene) and the frequency, respectively. Note that the vertical axes are shown logarithmically to demonstrate the exponential character of the distribution. Different rows and columns indicated the different conditions of phenotypic selection and different values of Cmut, respectively. Lines in each panel indicate the regression of the plot to the Power law distribution (red), exponential distribution (blue), and Poisson distribution (green). Regression was estimated by a nonlinear least-square method. To judge the goodness of regression, Akaike's information criterion (AIC) was used, and the regression that showed the smallest value of AIC was drawn as a thick line. POW, EXP and POI in each panel indicate the differences between AIC value of the best regression model and those of power-law (scale-free), exponential and poisson distributions, respectively.
Figure 12
Figure 12. Outdegree distribution of assembled GRNs that evolved under various Cmut levels.
Horizontal and vertical axes in each panel show the outdegree (the number of regulatory interactions that depart from a gene) and the frequency, respectively. Note that the both horizontal and vertical axes are shown logarithmically to demonstrate the scale-free character of the distribution. Different rows and columns show the different conditions of phenotypic selection and the different values of Cmut, respectively. Lines in each panel indicate the regression of the plot to the Power law distribution (red), exponential distribution (blue) and Poisson distribution (green). Regression was estimated by a nonlinear least-square method. To judge the goodness of the regression, Akaike's information criterion (AIC) was used, and the regression that showed the smallest value of AIC was drawn as a thick line. POW, EXP and POI in each panel indicate the differences between AIC value of the best regression model and those of power-law (scale-free), exponential and poisson distributions, respectively.
Figure 13
Figure 13. Relationships between GRN structures and the relative rates of gene duplication and gene deletion (μDELDUP).
Standard parameter value, μDELDUP = 1. To control the value of (μDELDUP), only μdel are varied from 10−7 to 10−5, while μdup was fixed at a standard value (10−6). Points connected by solid lines represent the mean number of core genes (#core), pseudo-expression genes (#psdexp), silent genes (#silent) and the time-averaged fitness (F′) in populations that evolved for 50,000 generations under each simulation condition. Vertical bars indicate 95% confidence intervals. Different colors indicate different conditions of phenotypic selection; d = 10−1, f = 10−1 (red); d = 100, f = 10−3 (blue); d = 10−3, f = 10−3 (black) under random-walk optimum shift.
Figure 14
Figure 14. GRN structures that evolved with horizontal transfer of regulatory genes.
Instead of the duplication of existing regulatory genes, a randomly created new regulatory gene was introduced into a GRN (i.e., μDUP = 0, μHOR = 10−6). All other parameters were set at standard values. Each point connected by solid lines represents the mean number of each type of genes in evolved GRNs under each selective condition. Vertical bars attached to the point represent 95% confidence intervals. d and f represent the amplitude and frequency of the optimum shift, respectively.

Similar articles

Cited by

References

    1. Carroll SB. Evo-devo and an expanding evolutionary synthesis: a genetic theory of morphological evolution. Cell. 2008;134:25–36. - PubMed
    1. Fox CW, Wolf JB. Evolutionary genetics : concepts and case studies. New York: Oxford University Press; 2006.
    1. Prud'homme B, Gompel N, Carroll SB. Emerging principles of regulatory evolution. Proc Natl Acad Sci USA. 2007;104:8605–8612. - PMC - PubMed
    1. Janga SC, Collado-Vides J. Structure and evolution of gene regulatory networks in microbial genomes. Res Microbiol. 2007;158:787–794. - PMC - PubMed
    1. Lozada-Chávez I, Janga SC, Collado-Vides J. Bacterial regulatory networks are extremely flexible in evolution. Nucleic Acids Res. 2006;34:3434–3445. - PMC - PubMed

Publication types