

Calcium signals driven by single channel noise
- PMID: 20700497
- PMCID: PMC2917103
- DOI: 10.1371/journal.pcbi.1000870
Calcium signals driven by single channel noise
Abstract
Usually, the occurrence of random cell behavior is appointed to small copy numbers of molecules involved in the stochastic process. Recently, we demonstrated for a variety of cell types that intracellular Ca2+ oscillations are sequences of random spikes despite the involvement of many molecules in spike generation. This randomness arises from the stochastic state transitions of individual Ca2+ release channels and does not average out due to the existence of steep concentration gradients. The system is hierarchical due to the structural levels channel--channel cluster--cell and a corresponding strength of coupling. Concentration gradients introduce microdomains which couple channels of a cluster strongly. But they couple clusters only weakly; too weak to establish deterministic behavior on cell level. Here, we present a multi-scale modelling concept for stochastic hierarchical systems. It simulates active molecules individually as Markov chains and their coupling by deterministic diffusion. Thus, we are able to follow the consequences of random single molecule state changes up to the signal on cell level. To demonstrate the potential of the method, we simulate a variety of experiments. Comparisons of simulated and experimental data of spontaneous oscillations in astrocytes emphasize the role of spatial concentration gradients in Ca2+ signalling. Analysis of extensive simulations indicates that frequency encoding described by the relation between average and standard deviation of interspike intervals is surprisingly robust. This robustness is a property of the random spiking mechanism and not a result of control.
Conflict of interest statement
The authors have declared that no competing interests exist.
Figures

 form channel clusters (green dots) that are randomly scattered across the membrane of the ER and separated by 1 to 7
  in the cell. B: Compared with inter-cluster distances, channels (orange) within a cluster are tightly packed in the ER membrane and are strongly coupled by
  (red). Channels within a cluster are lumped into one source term (green sphere) with radius
  , which depends on the number of open channels (see text). C: Single
  consist of four subunits the dynamics of which is described by the DeYoung-Keizer model. The 8 subunit states form a cube and subunit state transitions correspond to the edges. D: The
  dependent activation and inhibition of
  are key elements of
  induced
  release. Combined with the spatial clustering, the resulting hierarchical structure transforms fast fluctuating single channel dynamics (blips) first into locally amplified cluster signals (puffs) and then into cellular release spikes. (Local concentrations are determined 10 nm apart from the release site.)
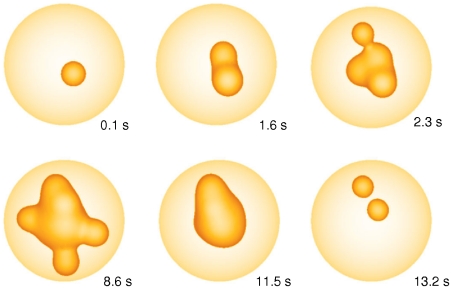
 release of adjacent clusters by diffusion and
  induced
  release leading to a global
  spike. The puff to spike transition is visualized by the iso-concentration surface of 2
  during a spike. Time is indicated on the panels (see Video S1).
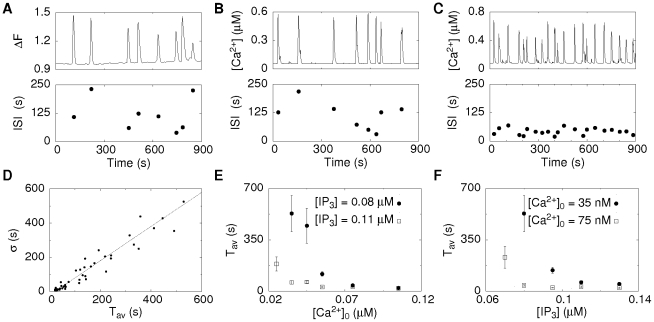
 oscillations in an astrocyte. The varying ISIs demonstrate the stochasticity of spiking. B,C: Simulations of the cellular
  dynamics of a cell with 47 clusters each having a random number of channels between 4 and 16 for different
  base level
  concentrations and the standard parameters given in Table 1. For a low
  base level of 30 nM spiking is rather slow and irregular (B). For an increased
  base level of 50 nM spiking becomes faster and more regular (C). D: The simulated
  −
− relation, where dots correspond to spike trains of single cells having different
  and
and  concentration (see Figure 5 in Text S1), is in accordance with the experimentally observed one supporting the wave nucleation mechanism. E,F: The dependence of the average period
  on the
  concentration and the
  resting concentration obtained in simulations show that regular spiking is more likely if one concentration is high.
 base level concentration
  nM and a
  concentration of 0.12
  . B: Spontaneous oscillations exhibit often a more irregular spiking. This is achieved in simulation for the same cellular setup as in A by a
  base level concentration of
  nM, which is lower than the standard value of 50 nM (Table 1). That decreases the probabilities for an initial event and spikes compared to panel A. The cell reaches the resting state before some of the spikes. C: A bursting like behavior is observed for decreased SERCA activity (
 ) in simulations, since
  remains longer in the cytosol. D: For a even smaller SERCA activity of
  ,
,  signals obtained in simulations exhibit plateau responses with superimposed oscillations which are also found in experiments. Simulation parameters are given in Table 1 if not stated here.
 EGTA increases
  and
and  for a population of simulated cells with different cell properties, very similar to experimental observations. D:
  increases with increasing EGTA (magenta) and BAPTA (black) concentration for a given cell. The value of the increase depends on the single channel current. Squares correspond to 0.12 pA and dots to 1.2 pA. E: Corresponding
  −
− dependence of simulations in panel D. BAPTA and EGTA lead to a similar
  −
− dependence for the smaller current (squares), whereas the increased current decreases the slope to 0.6. F: A single channel current of 0.12 pA leads to a population slope
  of 1 rather independent of spatial arrangement of clusters (gray), stimulation strength (light red) and pump strength (light blue) where the population slopes arise due to 10 different buffer concentrations (
 simulations for each condition). For the larger current of 1.2 pA the slope decreases to 0.6 and is again relatively independent of other physiologic parameters. This may explain the experimentally observed cell specific slopes . Parameters used in simulations are given in Table 1 if not explicitly stated here.
Similar articles
-
On the role of stochastic channel behavior in intracellular Ca2+ dynamics.Biophys J. 2003 Jan;84(1):42-56. doi: 10.1016/S0006-3495(03)74831-0. Biophys J. 2003. PMID: 12524264 Free PMC article.
-
Derivation of Ca2+ signals from puff properties reveals that pathway function is robust against cell variability but sensitive for control.Proc Natl Acad Sci U S A. 2011 Jan 4;108(1):427-32. doi: 10.1073/pnas.1008435108. Epub 2010 Dec 20. Proc Natl Acad Sci U S A. 2011. PMID: 21173273 Free PMC article.
-
The dynamics of stochastic attrition viewed as an absorption time on a terminating Markov chain.Cell Calcium. 2005 Aug;38(2):73-86. doi: 10.1016/j.ceca.2005.06.007. Cell Calcium. 2005. PMID: 16099503
-
Fundamental properties of Ca2+ signals.Biochim Biophys Acta. 2012 Aug;1820(8):1185-94. doi: 10.1016/j.bbagen.2011.10.007. Epub 2011 Oct 25. Biochim Biophys Acta. 2012. PMID: 22040723 Review.
-
Calcium oscillations.Cold Spring Harb Perspect Biol. 2011 Mar 1;3(3):a004226. doi: 10.1101/cshperspect.a004226. Cold Spring Harb Perspect Biol. 2011. PMID: 21421924 Free PMC article. Review.
Cited by
-
Exact and approximate stochastic simulation of intracellular calcium dynamics.J Biomed Biotechnol. 2011;2011:572492. doi: 10.1155/2011/572492. Epub 2011 Nov 9. J Biomed Biotechnol. 2011. PMID: 22131814 Free PMC article. Review.
-
Data-driven multiscale modeling reveals the role of metabolic coupling for the spatio-temporal growth dynamics of yeast colonies.BMC Mol Cell Biol. 2019 Dec 19;20(1):59. doi: 10.1186/s12860-019-0234-z. BMC Mol Cell Biol. 2019. PMID: 31856706 Free PMC article.
-
Purinoreceptors and ectonucleotidases control ATP-induced calcium waveforms and calcium-dependent responses in microglia: Roles of P2 receptors and CD39 in ATP-stimulated microglia.Front Physiol. 2023 Jan 9;13:1037417. doi: 10.3389/fphys.2022.1037417. eCollection 2022. Front Physiol. 2023. PMID: 36699679 Free PMC article.
-
Measuring edge importance: a quantitative analysis of the stochastic shielding approximation for random processes on graphs.J Math Neurosci. 2014 Apr 17;4(1):6. doi: 10.1186/2190-8567-4-6. J Math Neurosci. 2014. PMID: 24742077 Free PMC article.
-
Unraveling ChR2-driven stochastic Ca2+ dynamics in astrocytes: A call for new interventional paradigms.PLoS Comput Biol. 2021 Feb 10;17(2):e1008648. doi: 10.1371/journal.pcbi.1008648. eCollection 2021 Feb. PLoS Comput Biol. 2021. PMID: 33566841 Free PMC article.
References
Publication types
MeSH terms
Substances
LinkOut - more resources
Full Text Sources
Miscellaneous
