. 2010 Jul 21:4:58.
doi: 10.3389/fnhum.2010.00058. eCollection 2010.

The insular taste cortex contributes to odor quality coding

Affiliations

The insular taste cortex contributes to odor quality coding

Maria G Veldhuizen et al. Front Hum Neurosci. .

Abstract

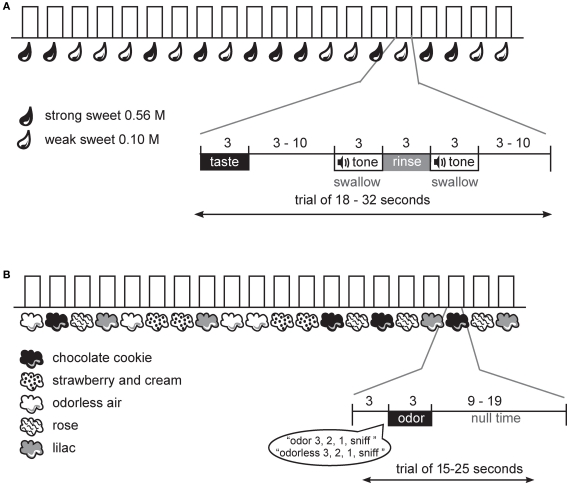
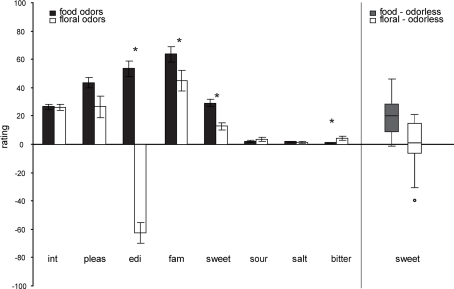
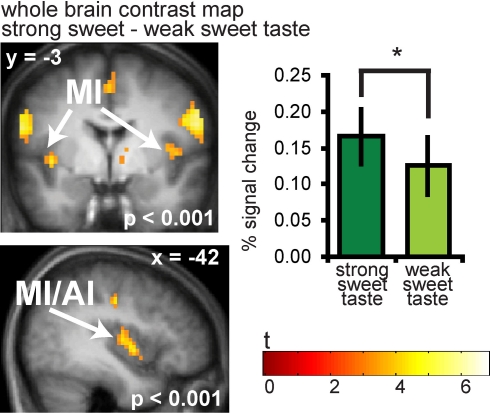
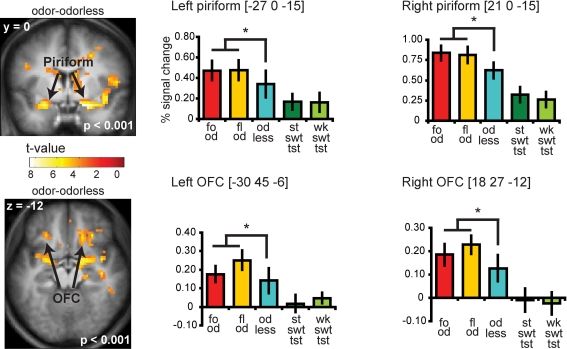
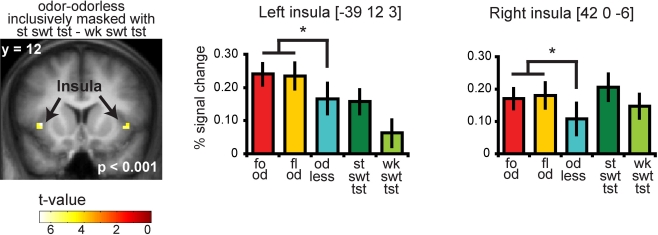
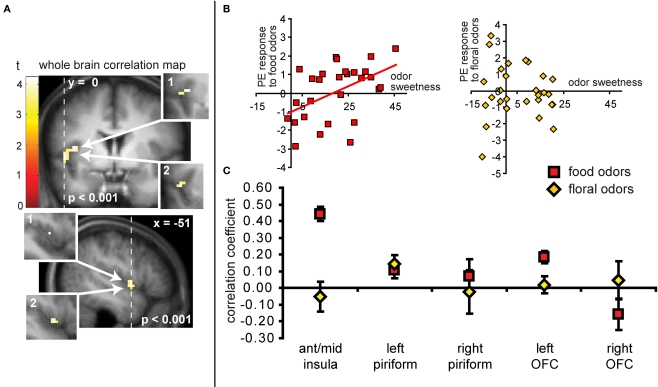
Despite distinct peripheral and central pathways, stimulation of both the olfactory and the gustatory systems may give rise to the sensation of sweetness. Whether there is a common central mechanism producing sweet quality sensations or two discrete mechanisms associated independently with gustatory and olfactory stimuli is currently unknown. Here we used fMRI to determine whether odor sweetness is represented in the piriform olfactory cortex, which is thought to code odor quality, or in the insular taste cortex, which is thought to code taste quality. Fifteen participants sampled two concentrations of a pure sweet taste (sucrose), two sweet food odors (chocolate and strawberry), and two sweet floral odors (lilac and rose). Replicating prior work we found that olfactory stimulation activated the piriform, orbitofrontal and insular cortices. Of these regions, only the insula also responded to sweet taste. More importantly, the magnitude of the response to the food odors, but not to the non-food odors, in this region of insula was positively correlated with odor sweetness rating. These findings demonstrate that insular taste cortex contributes to odor quality coding by representing the taste-like aspects of food odors. Since the effect was specific to the food odors, and only food odors are experienced with taste, we suggest this common central mechanism develops as a function of experiencing flavors.

Keywords: fMRI; flavor; gustatory; insula; multimodal; olfactory; piriform; sweet.


Figures

Figure 1
Figure 1
Design. (A) Schematic of gustatory protocol. At the onset of each trial the subject received the taste solution over 3 s. This was followed by a variable wait, a cue to swallow the taste solution, a rinse, and a cue to swallow the rinse. A variable interval followed until the start of the next trial. (B) Schematic of olfactory protocol. At the onset of each trial the subject heard a spoken word, indicating the trial type and then a countdown to sniff. Immediately following the word “sniff” the odor was delivered over 3 s. This was followed by a variable interval until the start of the next trial.
Figure 2
Figure 2
Left panel: Average perceptual ratings (y axis) over subjects (±s.e.m.) of the food (chocolate-cookie and strawberry-and-cream) and floral (rose and lilac) odors (x axis). Int, intensity; pleas, pleasantness; edi, edibility; fam, familiarity. Stars represent significant differences. Right Panel: Box plots illustrating the range and variability of sweetness rating for food and floral odors. Whiskers reflect the lowest and highest observation, the upper and lower boundaries of the box represent the upper and lower quartiles, the middle line of the box represents the median and the circle represents a single outlier, that was removed from the correlation analyses). Note that there is similar across-subject variability in food and floral sweetness ratings, as illustrated in right box and whisker plots.
Figure 3
Figure 3
Neural response in the insula to sweet taste. Coronal and sagittal sections of the insula showing response to strong sweet taste – weak sweet taste. In the bargraphs we plotted the average percent signal change for the two sweet taste conditions over subjects (±s.e.m.): (Figure 6A and 6B) strong sweet taste (dark green) and weak sweet taste (light green), averaged over subjects. The response was taken from the voxel that responded maximally, as identified in the SPM analysis. Thus, these estimates are non-independent, and are provided to illustrate the relative difference in neural response.
Figure 4
Figure 4
Coronal and axial sections showing neural response to food and floral odors vs. odorless air in bilateral piriform and OFC. The bar graphs show the percent signal change for the three odor conditions: food odors (fo od, red), floral (fl od, yellow), and odorless air (od less, blue) (±s.e.m.), averaged over subjects). The response was taken from the voxel that responded maximally, as identified in the SPM analysis. Thus, these estimates are non-independent, and are provided to illustrate the relative difference in neural response. For illustrative purposes we also plotted the percent signal change for the strong sweet taste (st swt tst, dark green) and the weak sweet taste (wk swt tst, light green), which do not show a differential response in piriform and OFC.
Figure 5
Figure 5
Coronal section showing neural response to food and floral odors vs. odorless air in bilateral insula, inclusively masked by response to strong sweet taste minus weak sweet taste. The bar graphs show the percent signal change for the three odor conditions: food (red), floral (yellow), and odorless air (blue), and the two taste conditions: strong sweet taste (dark green) and the weak sweet taste (light green) (±s.e.m.), averaged over subjects. The response was taken from the voxel that responded maximally, as identified in the SPM analysis. Thus, these estimates are non-independent, and are provided to illustrate the relative difference in neural response.
Figure 6
Figure 6
(A) Coronal and sagittal sections of the area of insula where neural response to the food odors shows a positive correlation with the sweetness ratings of those odors. The main images display the unmasked regression maps while the insets labeled 1 depict the masked regressions (i.e., using the “sweet odors and sweet taste overlap” inclusive mask). The insets labeled 2 depict the analysis with the pleasantness and familiarity ratings as covariates. (B) Shows neural response (in parameter estimate) in the insula (at the maximally responding voxel at −45 −3 9), plotted against sweetness ratings for the food (red squares) and floral odors (yellow diamonds). (C) Illustrates the magnitude of the correlation (averaged across all voxels ± standard deviation) in the insula for food odors (in red squares) and non-food odor (yellow diamonds) in comparison to the responses in other areas for food and non-food odors vs. odorless. Note that although there appears to be a significant difference between food and floral odors in the left OFC, this effect this effect does not survive our criterion for significance in SPM and is therefore not discussed.

References

    1. Bartoshuk L. M., Duffy V. B., Green B. G., Hoffman H. J., Ko C. W., Lucchina L. A., Marks L. E., Snyder D. J., Weiffenbach J. M. (2004). Valid across-group comparisons with labeled scales: the gLMS versus magnitude matching. Physiol. Behav. 82, 109–11410.1016/j.physbeh.2004.02.033 - DOI - PubMed
    1. Bartoshuk L. M., McBurney D. H., Pfaffmann C. (1964). Taste of sodium chloride solutions after adaptation to sodium chloride: implications for the “water taste”. Science 143, 967–96810.1126/science.143.3609.967 - DOI - PubMed
    1. Cerf-Ducastel B., Murphy C. (2001). fMRI activation in response to odorants orally delivered in aqueous solutions. Chem. Senses 26, 625–63710.1093/chemse/26.6.625 - DOI - PubMed
    1. De Araujo I. E., Rolls E. T., Kringelbach M. L., McGlone F., Phillips N. (2003). Taste-olfactory convergence, and the representation of the pleasantness of flavour, in the human brain. Eur. J. Neurosci. 18, 2059–206810.1046/j.1460-9568.2003.02915.x - DOI - PubMed
    1. Fortis-Santiago Y., Rodwin B. A., Neseliler S., Piette C. E., Katz D. B. (2010). State dependence of olfactory perception as a function of taste cortical inactivation. Nat. Neurosci. 13, 158–15910.1038/nn.2463 - DOI - PMC - PubMed

LinkOut - more resources