

Senescence is more important in the natural lives of long- than short-lived mammals
- PMID: 20700508
- PMCID: PMC2917356
- DOI: 10.1371/journal.pone.0012019
Senescence is more important in the natural lives of long- than short-lived mammals
Abstract
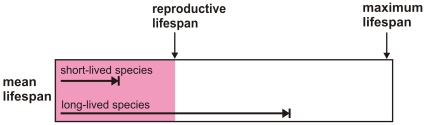
Background: Senescence has been widely detected among mammals, but its importance to fitness in wild populations remains controversial. According to evolutionary theories, senescence occurs at an age when selection is relatively weak, which in mammals can be predicted by adult survival rates. However, a recent analysis of senescence rates found more age-dependent mortalities in natural populations of longer lived mammal species. This has important implications to ageing research and for understanding the ecological relevance of senescence, yet so far these have not been widely appreciated. We re-address this question by comparing the mean and maximum life span of 125 mammal species. Specifically, we test the hypothesis that senescence occurs at a younger age relative to the mean natural life span in longer lived species.
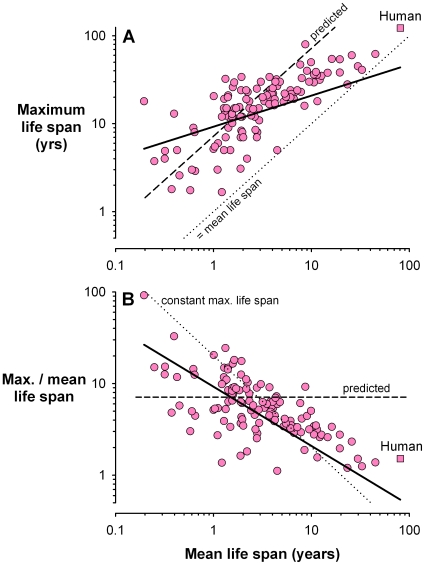
Methodology/principal findings: We show, using phylogenetically-informed generalised least squares models, a significant log-log relationship between mean life span, as calculated from estimates of adult survival for natural populations, and maximum recorded life span among mammals (R2=0.57, p<0.0001). This provides further support for a key prediction of evolutionary theories of ageing. The slope of this relationship (0.353+/-0.052 s.e.m.), however, indicated that mammals with higher survival rates have a mean life span representing a greater fraction of their potential maximum life span: the ratio of maximum to mean life span decreased significantly from >10 in short-lived to approximately 1.5 in long-lived mammal species.
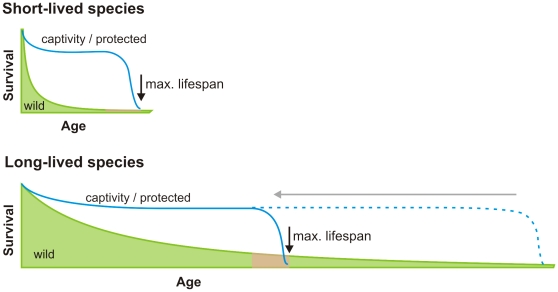
Conclusions/significance: We interpret the ratio of maximum to mean life span to be an index of the likelihood an individual will experience senescence, which largely determines maximum life span. Our results suggest that senescence occurs at an earlier age relative to the mean life span, and therefore is experienced by more individuals and remains under selection pressure, in long- compared to short-lived mammals. A minimum rate of somatic degradation may ultimately limit the natural life span of mammals. Our results also indicate that senescence and modulating factors like oxidative stress are increasingly important to the fitness of longer lived mammals (and vice versa).
Conflict of interest statement
Figures
Similar articles
-
Variation in actuarial senescence does not reflect life span variation across mammals.PLoS Biol. 2019 Sep 13;17(9):e3000432. doi: 10.1371/journal.pbio.3000432. eCollection 2019 Sep. PLoS Biol. 2019. PMID: 31518381 Free PMC article.
-
Ageing and the extinction of large animals.Biogerontology. 2005;6(2):151-6. doi: 10.1007/s10522-005-3458-6. Biogerontology. 2005. PMID: 16034683
-
Reproductive senescence in a short-lived fish.J Anim Ecol. 2021 Feb;90(2):492-502. doi: 10.1111/1365-2656.13382. Epub 2020 Nov 17. J Anim Ecol. 2021. PMID: 33159690
-
Insights from comparative analyses of aging in birds and mammals.Aging Cell. 2010 Apr;9(2):273-84. doi: 10.1111/j.1474-9726.2009.00542.x. Epub 2009 Dec 23. Aging Cell. 2010. PMID: 20041859 Free PMC article. Review.
-
Selection for maximum longevity in mice.Exp Gerontol. 1997 Jan-Apr;32(1-2):65-78. doi: 10.1016/s0531-5565(96)00034-4. Exp Gerontol. 1997. PMID: 9088903 Review.
Cited by
-
Neuroendocrine control of the transition to reproductive senescence: lessons learned from the female rodent model.Neuroendocrinology. 2012;96(1):1-12. doi: 10.1159/000335994. Epub 2012 Feb 17. Neuroendocrinology. 2012. PMID: 22354218 Free PMC article. Review.
-
Evolutionary significance of maternal kinship in a long-lived mammal.Philos Trans R Soc Lond B Biol Sci. 2019 Sep 2;374(1780):20180067. doi: 10.1098/rstb.2018.0067. Epub 2019 Jul 15. Philos Trans R Soc Lond B Biol Sci. 2019. PMID: 31303162 Free PMC article.
-
Maternal survival costs in an asocial mammal.Ecol Evol. 2022 May 11;12(5):e8874. doi: 10.1002/ece3.8874. eCollection 2022 May. Ecol Evol. 2022. PMID: 35592067 Free PMC article.
-
Relative demographic susceptibility does not explain the extinction chronology of Sahul's megafauna.Elife. 2021 Mar 30;10:e63870. doi: 10.7554/eLife.63870. Elife. 2021. PMID: 33783356 Free PMC article.
-
Life histories and the evolution of cooperative breeding in mammals.Proc Biol Sci. 2012 Oct 7;279(1744):4065-70. doi: 10.1098/rspb.2012.1433. Epub 2012 Aug 8. Proc Biol Sci. 2012. PMID: 22874752 Free PMC article.
References
-
- Oeppen J, Vaupel JW. Broken limits to life expectancy. Science. 2002;296:1029–1031. - PubMed
-
- Jones OR, Gaillard JM, Tuljapurkar S, Alho JS, Armitage KB, et al. Senescence rates are determined by ranking on the fast-slow life-history continuum. Ecol Lett. 2008;11:664–673. - PubMed
-
- Nussey DH, Coulson T, Festa-Bianchet M, Gaillard JM. Measuring senescence in wild animal populations: towards a longitudinal approach. Funct Ecol. 2008;22:393–406.
Publication types
MeSH terms
LinkOut - more resources
Full Text Sources
Medical
