

Attraction basins as gauges of robustness against boundary conditions in biological complex systems
- PMID: 20700525
- PMCID: PMC2916819
- DOI: 10.1371/journal.pone.0011793
Attraction basins as gauges of robustness against boundary conditions in biological complex systems
Abstract
One fundamental concept in the context of biological systems on which researches have flourished in the past decade is that of the apparent robustness of these systems, i.e., their ability to resist to perturbations or constraints induced by external or boundary elements such as electromagnetic fields acting on neural networks, micro-RNAs acting on genetic networks and even hormone flows acting both on neural and genetic networks. Recent studies have shown the importance of addressing the question of the environmental robustness of biological networks such as neural and genetic networks. In some cases, external regulatory elements can be given a relevant formal representation by assimilating them to or modeling them by boundary conditions. This article presents a generic mathematical approach to understand the influence of boundary elements on the dynamics of regulation networks, considering their attraction basins as gauges of their robustness. The application of this method on a real genetic regulation network will point out a mathematical explanation of a biological phenomenon which has only been observed experimentally until now, namely the necessity of the presence of gibberellin for the flower of the plant Arabidopsis thaliana to develop normally.
Conflict of interest statement
Figures
 and
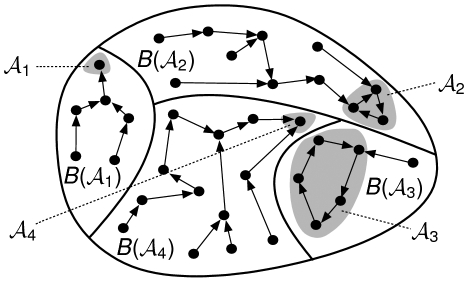
and  , and two limit cycles,
  and
and  . The attraction basins of these attractors are respectively
  ,
,  ,
,  and
and  .
.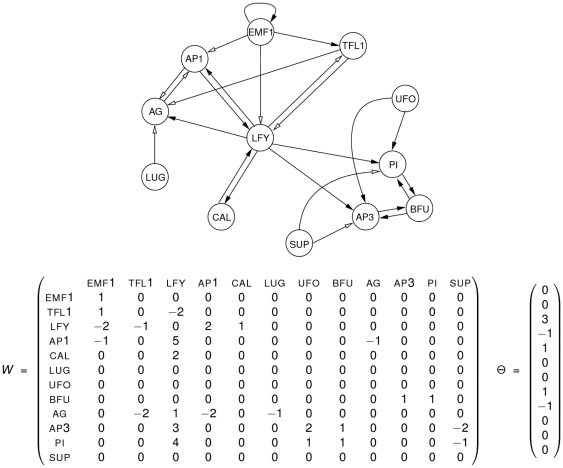
 of size
  contains the interaction weights between genes and
  is the thresholds vector.

 of the reduced Mendoza & Alvarez-Buylla network
  pictured in Figure 3. In this graph, for the sake of clarity, we have represented
  arcs with the same beginning and ending as one unique arc labelled by
  . The sub-graph in grey corresponds to a limit cycle of the connected component with the parallel iteration mode. It induces limit cycles 1, 3, 4, 6 and 7 of Table 1. Note that when the state of nodes
  in
in  (this always becomes true after a few steps according to the proof of Proposition 1), then the connected component
  is free to evolve as pictured by this general iteration graph.
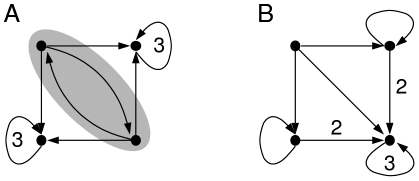
 of the reduced Mendoza & Alvarez-Buylla network
  pictured in Figure 3 (a) when the states of nodes
  and (b) when they are both fixed to
  . In this graph, for the sake of clarity, we have represented
  arcs with the same beginning and ending as one unique arc labelled by
  . The sub-graph in grey is a limit cycle of the connected component with the parallel iteration mode. It induces limit cycles 2, 3, 4 and 5 of Table 1. Note that when the state of nodes
  in
in  (this always becomes true after a few steps according to the proof of Proposition 1), then the connected component
  is free to evolve as pictured by one of these two general iteration graphs since no other nodes than
  or both
  have an influence on them.
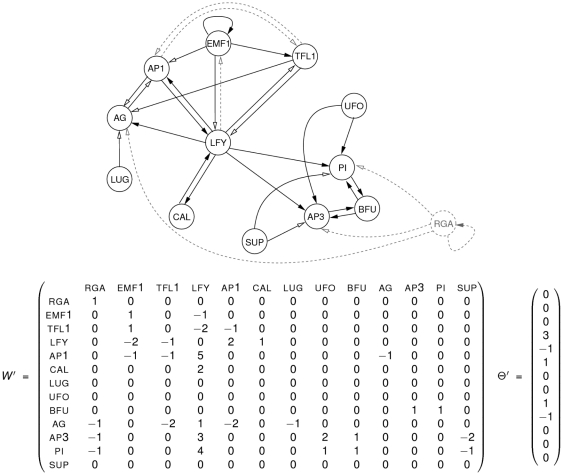
 of size
  contains the interaction weights.
  is the activation thresholds vector.

 ) of the probabilities of passage from any attraction basin to any other.
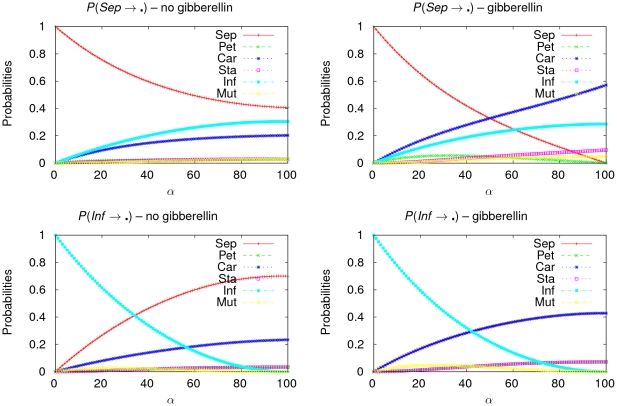
 (in percents). The top panels (resp. the bottom panels) plot the curves of the characteristic polynomials of the probabilities of passage from the sepal (resp. inflorescence) attraction basin to another attraction basin when the state of
  by the presence of gibberellin (right panel). Every panel plots six curves, one for each ordered couple of attraction basins. In the bottom panels, several curves are superimposed: the curves of the characteristic polynomials corresponding to the probabilities to become either a Pet configuration or a Sta configuration in the left panel as well as the curves of the characteristic polynomials corresponding to the probabilities to become either a Sep configuration or a Car configuration in the right panel.
Similar articles
-
Gibberellin acts positively then negatively to control onset of flower formation in Arabidopsis.Science. 2014 May 9;344(6184):638-41. doi: 10.1126/science.1250498. Science. 2014. PMID: 24812402
-
Floral morphogenesis: stochastic explorations of a gene network epigenetic landscape.PLoS One. 2008;3(11):e3626. doi: 10.1371/journal.pone.0003626. Epub 2008 Nov 3. PLoS One. 2008. PMID: 18978941 Free PMC article.
-
Robustness in regulatory interaction networks. A generic approach with applications at different levels: physiologic, metabolic and genetic.Int J Mol Sci. 2009 Nov 20;10(10):4437-4473. doi: 10.3390/ijms10104437. Int J Mol Sci. 2009. PMID: 20057955 Free PMC article.
-
Gene networks controlling the initiation of flower development.Trends Genet. 2010 Dec;26(12):519-27. doi: 10.1016/j.tig.2010.09.001. Epub 2010 Oct 13. Trends Genet. 2010. PMID: 20947199 Review.
-
Regulation of stamen development by coordinated actions of jasmonate, auxin, and gibberellin in Arabidopsis.Mol Plant. 2013 Jul;6(4):1065-73. doi: 10.1093/mp/sst054. Epub 2013 Mar 29. Mol Plant. 2013. PMID: 23543439 Review.
Cited by
-
A Network Model to Describe the Terminal Differentiation of B Cells.PLoS Comput Biol. 2016 Jan 11;12(1):e1004696. doi: 10.1371/journal.pcbi.1004696. eCollection 2016 Jan. PLoS Comput Biol. 2016. PMID: 26751566 Free PMC article.
-
Boolean modelling in plant biology.Quant Plant Biol. 2022 Dec 20;3:e29. doi: 10.1017/qpb.2022.26. eCollection 2022. Quant Plant Biol. 2022. PMID: 37077966 Free PMC article. Review.
-
Discrete dynamics of contagious social diseases: Example of obesity.Virulence. 2016;7(2):129-40. doi: 10.1080/21505594.2015.1082708. Epub 2015 Sep 16. Virulence. 2016. PMID: 26375495 Free PMC article.
-
Entropy as a Robustness Marker in Genetic Regulatory Networks.Entropy (Basel). 2020 Feb 25;22(3):260. doi: 10.3390/e22030260. Entropy (Basel). 2020. PMID: 33286034 Free PMC article.
-
An Integrative Network Modeling Approach to T CD4 Cell Activation.Front Physiol. 2020 Apr 23;11:380. doi: 10.3389/fphys.2020.00380. eCollection 2020. Front Physiol. 2020. PMID: 32425809 Free PMC article.
References
-
- Ben Amor H, Demongeot J, Sené S. MICAI. Atizapán de Zaragoza, Mexico: Springer; 2008. Structural sensitivity in neural and genetic networks. pp. 973–986. volume 5317 of Lecture Notes in Computer Science.
-
- Demongeot J, Jézéquel C, Sené S. Boundary conditions and phase transitions in neural networks. Theoretical results. Neural Networks. 2008;21:971–979. - PubMed
-
- Demongeot J, Sené S. Boundary conditions and phase transitions in neural networks. Simulation results. Neural Networks. 2008;21:962–970. - PubMed
-
- Sené S. Influence des conditions de bord dans les réseaux d'automates booléens à seuil et application à la biologie. 2008. Ph.D. thesis, Université Joseph Fourier de Grenoble.
-
- Elena A, Demongeot J. CISIS. Barcelona, Spain: IEEE Press; 2008. Interaction motifs in regulatory networks and structural robustness. pp. 682–686.
Publication types
MeSH terms
Substances
LinkOut - more resources
Full Text Sources
Miscellaneous
