sRNAscanner: a computational tool for intergenic small RNA detection in bacterial genomes
- PMID: 20700540
- PMCID: PMC2916834
- DOI: 10.1371/journal.pone.0011970
sRNAscanner: a computational tool for intergenic small RNA detection in bacterial genomes
Erratum in
- PLoS One. 2010;5(9). doi: 10.1371/annotation/71408e55-e1d3-4950-9c3b-d3a3ad66a1ff. Narmada, Suryanarayanan Ramkumar [corrected to Sambaturu, Narmada]
Abstract
Background: Bacterial non-coding small RNAs (sRNAs) have attracted considerable attention due to their ubiquitous nature and contribution to numerous cellular processes including survival, adaptation and pathogenesis. Existing computational approaches for identifying bacterial sRNAs demonstrate varying levels of success and there remains considerable room for improvement.
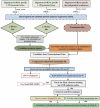
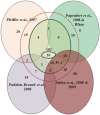
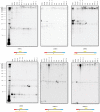
Methodology/principal findings: Here we have proposed a transcriptional signal-based computational method to identify intergenic sRNA transcriptional units (TUs) in completely sequenced bacterial genomes. Our sRNAscanner tool uses position weight matrices derived from experimentally defined E. coli K-12 MG1655 sRNA promoter and rho-independent terminator signals to identify intergenic sRNA TUs through sliding window based genome scans. Analysis of genomes representative of twelve species suggested that sRNAscanner demonstrated equivalent sensitivity to sRNAPredict2, the best performing bioinformatics tool available presently. However, each algorithm yielded substantial numbers of known and uncharacterized hits that were unique to one or the other tool only. sRNAscanner identified 118 novel putative intergenic sRNA genes in Salmonella enterica Typhimurium LT2, none of which were flagged by sRNAPredict2. Candidate sRNA locations were compared with available deep sequencing libraries derived from Hfq-co-immunoprecipitated RNA purified from a second Typhimurium strain (Sittka et al. (2008) PLoS Genetics 4: e1000163). Sixteen potential novel sRNAs computationally predicted and detected in deep sequencing libraries were selected for experimental validation by Northern analysis using total RNA isolated from bacteria grown under eleven different growth conditions. RNA bands of expected sizes were detected in Northern blots for six of the examined candidates. Furthermore, the 5'-ends of these six Northern-supported sRNA candidates were successfully mapped using 5'-RACE analysis.
Conclusions/significance: We have developed, computationally examined and experimentally validated the sRNAscanner algorithm. Data derived from this study has successfully identified six novel S. Typhimurium sRNA genes. In addition, the computational specificity analysis we have undertaken suggests that approximately 40% of sRNAscanner hits with high cumulative sum of scores represent genuine, undiscovered sRNA genes. Collectively, these data strongly support the utility of sRNAscanner and offer a glimpse of its potential to reveal large numbers of sRNA genes that have to date defied identification. sRNAscanner is available from: http://bicmku.in:8081/sRNAscanner or http://cluster.physics.iisc.ernet.in/sRNAscanner/.
Conflict of interest statement
Figures


Similar articles
-
Identification of 17 Pseudomonas aeruginosa sRNAs and prediction of sRNA-encoding genes in 10 diverse pathogens using the bioinformatic tool sRNAPredict2.Nucleic Acids Res. 2006;34(12):3484-93. doi: 10.1093/nar/gkl453. Nucleic Acids Res. 2006. PMID: 16870723 Free PMC article.
-
Prediction of Sinorhizobium meliloti sRNA genes and experimental detection in strain 2011.BMC Genomics. 2008 Sep 16;9:416. doi: 10.1186/1471-2164-9-416. BMC Genomics. 2008. PMID: 18793445 Free PMC article.
-
High-throughput, kingdom-wide prediction and annotation of bacterial non-coding RNAs.PLoS One. 2008 Sep 12;3(9):e3197. doi: 10.1371/journal.pone.0003197. PLoS One. 2008. PMID: 18787707 Free PMC article.
-
How to find small non-coding RNAs in bacteria.Biol Chem. 2005 Dec;386(12):1219-38. doi: 10.1515/BC.2005.140. Biol Chem. 2005. PMID: 16336117 Review.
-
Identification of bacterial small non-coding RNAs: experimental approaches.Curr Opin Microbiol. 2007 Jun;10(3):257-61. doi: 10.1016/j.mib.2007.05.003. Epub 2007 Jun 5. Curr Opin Microbiol. 2007. PMID: 17553733 Review.
Cited by
-
Devising Isolation Forest-Based Method to Investigate the sRNAome of Mycobacterium tuberculosis Using sRNA-seq Data.Bioinform Biol Insights. 2024 Jul 30;18:11779322241263674. doi: 10.1177/11779322241263674. eCollection 2024. Bioinform Biol Insights. 2024. PMID: 39091283 Free PMC article.
-
A leucine responsive small RNA AbcR200 regulates expression of the lactate utilization (lut) operon in Acinetobacter baumannii DS002.J Biol Chem. 2025 Feb;301(2):108160. doi: 10.1016/j.jbc.2025.108160. Epub 2025 Jan 10. J Biol Chem. 2025. PMID: 39800307 Free PMC article.
-
Identification of novel growth phase- and media-dependent small non-coding RNAs in Streptococcus pyogenes M49 using intergenic tiling arrays.BMC Genomics. 2012 Oct 13;13:550. doi: 10.1186/1471-2164-13-550. BMC Genomics. 2012. PMID: 23062031 Free PMC article.
-
Gene regulation by CcpA and catabolite repression explored by RNA-Seq in Streptococcus mutans.PLoS One. 2013;8(3):e60465. doi: 10.1371/journal.pone.0060465. Epub 2013 Mar 28. PLoS One. 2013. PMID: 23555977 Free PMC article.
-
Transcriptome based Identification of silver stress responsive sRNAs from Bacillus cereus ATCC14579.Bioinformation. 2019 Jul 31;15(7):474-479. doi: 10.6026/97320630015474. eCollection 2019. Bioinformation. 2019. PMID: 31485133 Free PMC article.
References
-
- Masse E, Majdalani N, Gottesman S. Regulatory roles for small RNAs in bacteria. Curr Opin Microbiol. 2003;6:120–124. - PubMed
-
- Vanderpool CK, Gottesman S. Involvement of a novel transcriptional activator and small RNA in post-transcriptional regulation of the glucose phosphoenolpyruvate phosphotransferase system. Mol Microbiol. 2004;54:1076–1089. - PubMed
Publication types
MeSH terms
Substances
LinkOut - more resources
Full Text Sources
Other Literature Sources

