

Metabolic profiling and the metabolome-wide association study: significance level for biomarker identification
- PMID: 20701291
- PMCID: PMC2941198
- DOI: 10.1021/pr1003449
Metabolic profiling and the metabolome-wide association study: significance level for biomarker identification
Abstract
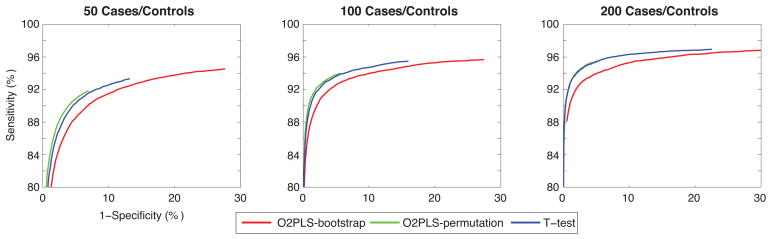
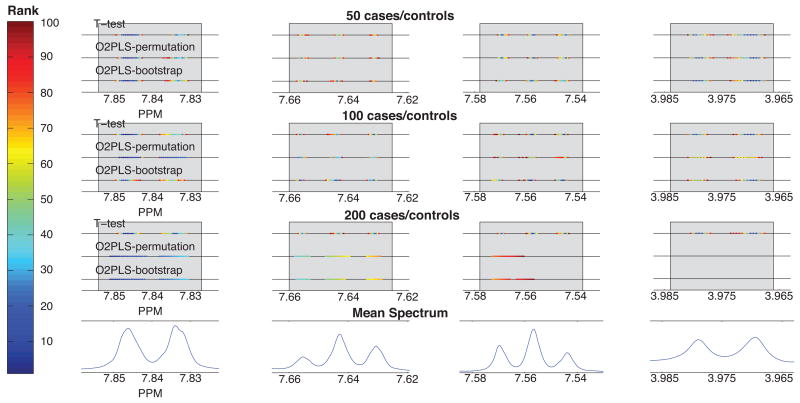
High throughput metabolic profiling via the metabolome-wide association study (MWAS) is a powerful new approach to identify biomarkers of disease risk, but there are methodological challenges: high dimensionality, high level of collinearity, the existence of peak overlap within metabolic spectral data, multiple testing, and selection of a suitable significance threshold. We define the metabolome-wide significance level (MWSL) as the threshold required to control the family wise error rate through a permutation approach. We used 1H NMR spectroscopic profiles of 24 h urinary collections from the INTERMAP study. Our results show that the MWSL primarily depends on sample size and spectral resolution. The MWSL estimates can be used to guide selection of discriminatory biomarkers in MWA studies. In a simulation study, we compare statistical performance of the MWSL approach to two variants of orthogonal partial least-squares (OPLS) method with respect to statistical power, false positive rate and correspondence of ranking of the most significant spectral variables. Our results show that the MWSL approach as estimated by the univariate t test is not outperformed by OPLS and offers a fast and simple method to detect disease-related discriminatory features in human NMR urinary metabolic profiles.
Figures
References
Publication types
MeSH terms
Substances
Grants and funding
- G0801056/MRC_/Medical Research Council/United Kingdom
- BB/E020372/1/BB_/Biotechnology and Biological Sciences Research Council/United Kingdom
- R01 HL50490/HL/NHLBI NIH HHS/United States
- P09870_DFHM/BB_/Biotechnology and Biological Sciences Research Council/United Kingdom
- R01 HL050490/HL/NHLBI NIH HHS/United States
LinkOut - more resources
Full Text Sources
