

The attrition rate of licensed chiropractors in California: an exploratory ecological investigation of time-trend data
- PMID: 20701811
- PMCID: PMC2925831
- DOI: 10.1186/1746-1340-18-24
The attrition rate of licensed chiropractors in California: an exploratory ecological investigation of time-trend data
Abstract
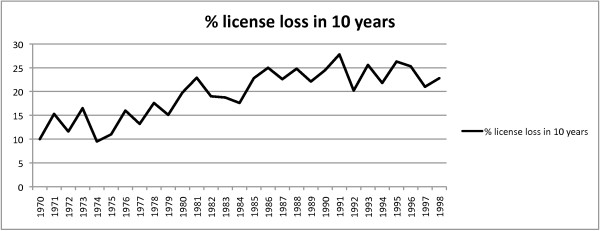
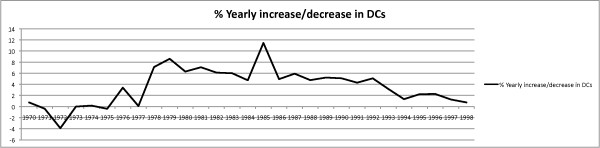
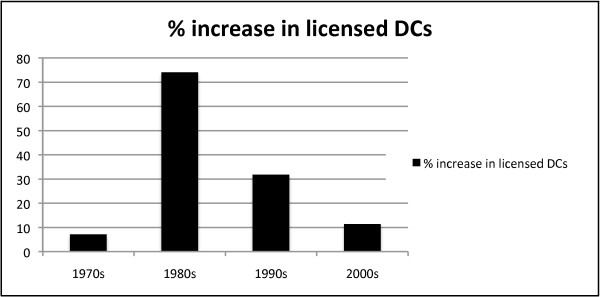
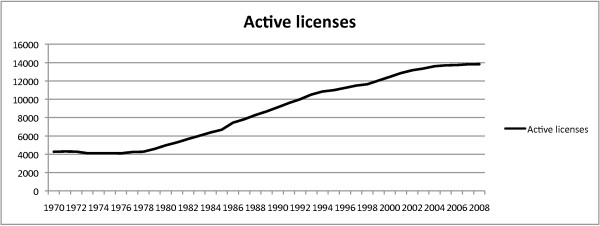
Background: The authors hypothesized the attrition rate of licensed chiropractors in California has gradually increased over the past several decades. "Attrition" as determined for this study is defined as a loss of legal authority to practice chiropractic for any reason during the first 10 years after the license was issued. The percentage of license attrition after 10 years was determined for each group of graduates licensed in California each year between 1970 and 1998. The cost of tuition, the increase in the supply of licensed chiropractors and the ratio of licensed chiropractors to California residents were examined as possible influences on the rate of license attrition.
Methods: The attrition rate was determined by a retrospective analysis of license status data obtained from the California Department of Consumer Affairs. Other variables were determined from US Bureau of Census data, survey data from the American Chiropractic Association and catalogs from a US chiropractic college.
Results: The 10-year attrition rate rose from 10% for those graduates licensed in 1970 to a peak of 27.8% in 1991. The 10-year attrition rate has since remained between 20-25% for the doctors licensed between 1992-1998.
Conclusions: Available evidence supports the hypothesis that the attrition rate for licensed chiropractors in the first 10 years of practice has risen in the past several decades.
Figures
Similar articles
-
Chiropractic Profession Attrition: A Narrative Review of Studies Over the Past 30 Years.J Chiropr Humanit. 2023 Jun 2;30:9-15. doi: 10.1016/j.echu.2023.02.001. eCollection 2023 Dec. J Chiropr Humanit. 2023. PMID: 37313265 Free PMC article. Review.
-
Attitudes of non-practicing chiropractors: a pilot survey concerning factors related to attrition.Chiropr Osteopat. 2010 Nov 4;18:29. doi: 10.1186/1746-1340-18-29. Chiropr Osteopat. 2010. PMID: 21050461 Free PMC article.
-
The supply and demand of chiropractors in the United States from 1996 to 2005.Altern Ther Health Med. 2009 May-Jun;15(3):36-40. Altern Ther Health Med. 2009. PMID: 19472863
-
Skills, attitudes and uptake of evidence-based practice: a cross-sectional study of chiropractors in the Swedish Chiropractic Association.Chiropr Man Therap. 2021 Jan 11;29(1):2. doi: 10.1186/s12998-020-00359-w. Chiropr Man Therap. 2021. PMID: 33423697 Free PMC article.
-
Barriers to expanding primary care roles for chiropractors: The role of chiropractic as primary care gatekeeper.J Manipulative Physiol Ther. 2002 Sep;25(7):427-49. doi: 10.1067/mmt.2002.126474. J Manipulative Physiol Ther. 2002. PMID: 12214185 Review.
Cited by
-
Chiropractic Profession Attrition: A Narrative Review of Studies Over the Past 30 Years.J Chiropr Humanit. 2023 Jun 2;30:9-15. doi: 10.1016/j.echu.2023.02.001. eCollection 2023 Dec. J Chiropr Humanit. 2023. PMID: 37313265 Free PMC article. Review.
-
A new role for spinal manual therapy and for chiropractic? Part I: weaknesses and threats.Chiropr Man Therap. 2024 Mar 26;32(1):11. doi: 10.1186/s12998-024-00531-6. Chiropr Man Therap. 2024. PMID: 38532401 Free PMC article.
-
The relationship between chiropractor required and current level of business knowledge.Chiropr Man Therap. 2017 Feb 6;25:3. doi: 10.1186/s12998-017-0134-2. eCollection 2017. Chiropr Man Therap. 2017. PMID: 28191305 Free PMC article.
-
Financial attitudes, knowledge, and habits of chiropractic students: A descriptive survey.J Can Chiropr Assoc. 2014 Mar;58(1):58-65. J Can Chiropr Assoc. 2014. PMID: 24587498 Free PMC article.
-
Attitudes of non-practicing chiropractors: a pilot survey concerning factors related to attrition.Chiropr Osteopat. 2010 Nov 4;18:29. doi: 10.1186/1746-1340-18-29. Chiropr Osteopat. 2010. PMID: 21050461 Free PMC article.
References
-
- California Board of Chiropractic Examiners - Rules and Regulations. http://www.chiro.ca.gov/business_regulations.htm Title 16, Division 4, Article 6, §355 Accessed 6/26/10.
-
- California Department of Consumer Affairs. License Verification, Board of Chiropractic Examiners. http://www2.dca.ca.gov/pls/wllpub/wllqryna$lcev2.startup?p_qte_code=DC&p... Accessed 1/13/10.
-
- National Board of Chiropractic Examiners. Job Analysis of Chiropractic. 2005. http://www.nbce.org/publication/job-analysis.html Accessed 1/13/10.
LinkOut - more resources
Full Text Sources
Miscellaneous
