

Validation of psoriatic arthritis diagnoses in electronic medical records using natural language processing
- PMID: 20701955
- PMCID: PMC3691811
- DOI: 10.1016/j.semarthrit.2010.05.002
Validation of psoriatic arthritis diagnoses in electronic medical records using natural language processing
Abstract
Objectives: To test whether data extracted from full text patient visit notes from an electronic medical record would improve the classification of psoriatic arthritis (PsA) compared with an algorithm based on codified data.
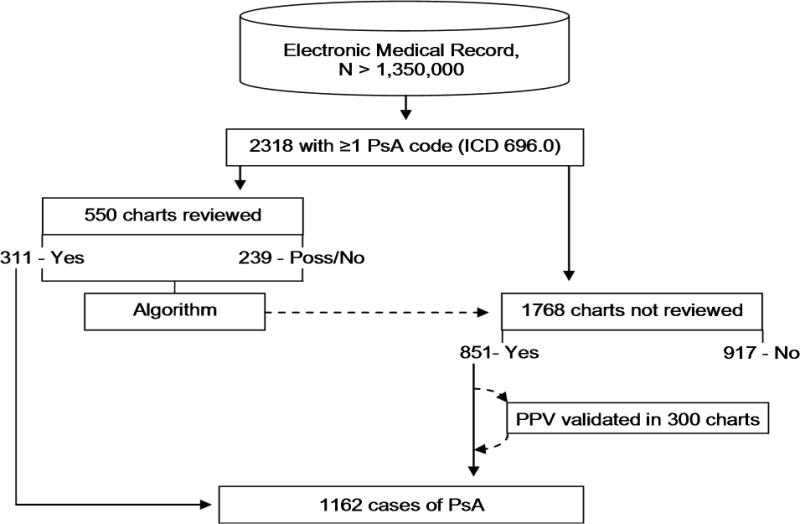
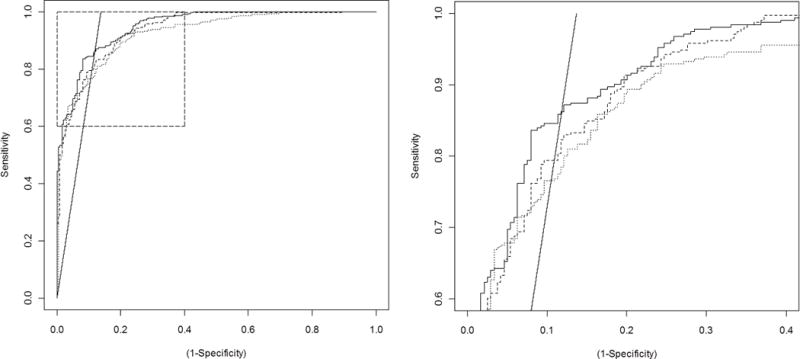
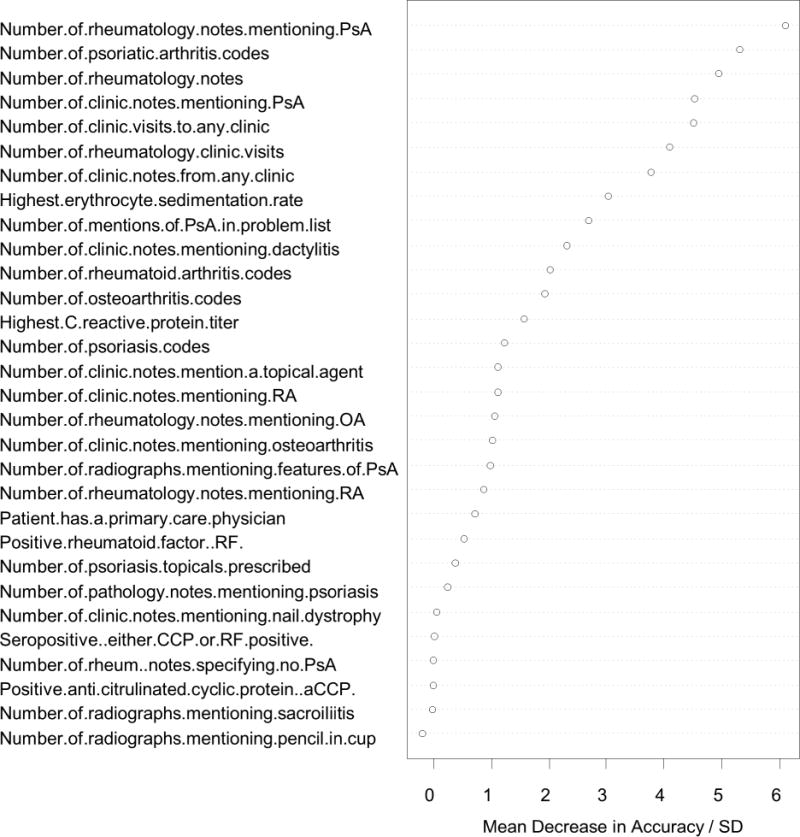
Methods: From the >1,350,000 adults in a large academic electronic medical record, all 2318 patients with a billing code for PsA were extracted and 550 were randomly selected for chart review and algorithm training. Using codified data and phrases extracted from narrative data using natural language processing, 31 predictors were extracted and 3 random forest algorithms were trained using coded, narrative, and combined predictors. The receiver operator curve was used to identify the optimal algorithm and a cut-point was chosen to achieve the maximum sensitivity possible at a 90% positive predictive value (PPV). The algorithm was then used to classify the remaining 1768 charts and finally validated in a random sample of 300 cases predicted to have PsA.
Results: The PPV of a single PsA code was 57% (95% CI 55%-58%). Using a combination of coded data and natural language processing (NLP), the random forest algorithm reached a PPV of 90% (95% CI 86%-93%) at a sensitivity of 87% (95% CI 83%-91%) in the training data. The PPV was 93% (95% CI 89%-96%) in the validation set. Adding NLP predictors to codified data increased the area under the receiver operator curve (P < 0.001).
Conclusions: Using NLP with text notes from electronic medical records improved the performance of the prediction algorithm significantly. Random forests were a useful tool to accurately classify psoriatic arthritis cases to enable epidemiological research.
Copyright © 2011 Elsevier Inc. All rights reserved.
Figures
References
-
- Shbeeb M, Uramoto KM, Gibson LE, O’Fallon WM, Gabriel SE. The epidemiology of psoriatic arthritis in Olmsted County, Minnesota, USA, 1982–1991. The Journal of rheumatology. 2000 May;27(5):1247–50. - PubMed
-
- Madland TM, Apalset EM, Johannessen AE, Rossebo B, Brun JG. Prevalence, disease manifestations, and treatment of psoriatic arthritis in Western Norway. The Journal of rheumatology. 2005 Oct;32(10):1918–22. - PubMed
-
- Love TJ, Gudbjornsson B, Gudjonsson JE, Valdimarsson H. Psoriatic arthritis in Reykjavik, Iceland: prevalence, demographics, and disease course. The Journal of rheumatology. 2007 Oct;34(10):2082–8. - PubMed
-
- Singh JA, Holmgren AR, Noorbaloochi S. Accuracy of Veterans Administration databases for a diagnosis of rheumatoid arthritis. Arthritis and rheumatism. 2004 Dec 15;51(6):952–7. - PubMed
-
- Thomas SL, Edwards CJ, Smeeth L, Cooper C, Hall AJ. How accurate are diagnoses for rheumatoid arthritis and juvenile idiopathic arthritis in the general practice research database? Arthritis and rheumatism. 2008 Sep 15;59(9):1314–21. - PubMed
Publication types
MeSH terms
Grants and funding
LinkOut - more resources
Full Text Sources
Medical
Research Materials
Miscellaneous
