. 2010 Oct 15;285(42):32325-35.
doi: 10.1074/jbc.M110.157164. Epub 2010 Aug 11.

Regulation of response regulator autophosphorylation through interdomain contacts

Affiliations

Regulation of response regulator autophosphorylation through interdomain contacts

Christopher M Barbieri et al. J Biol Chem. .

Abstract

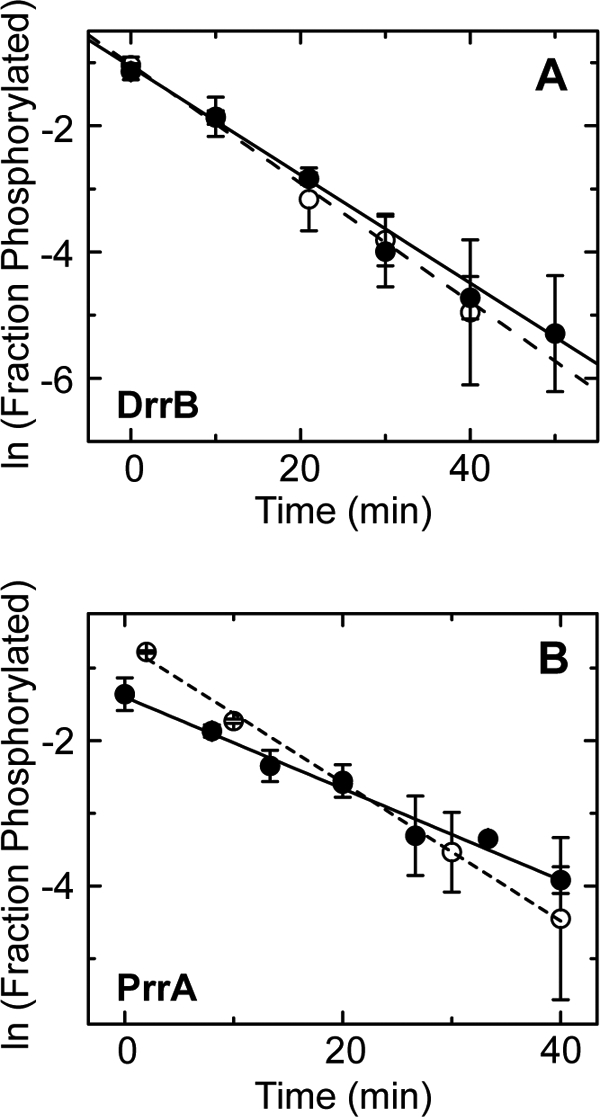
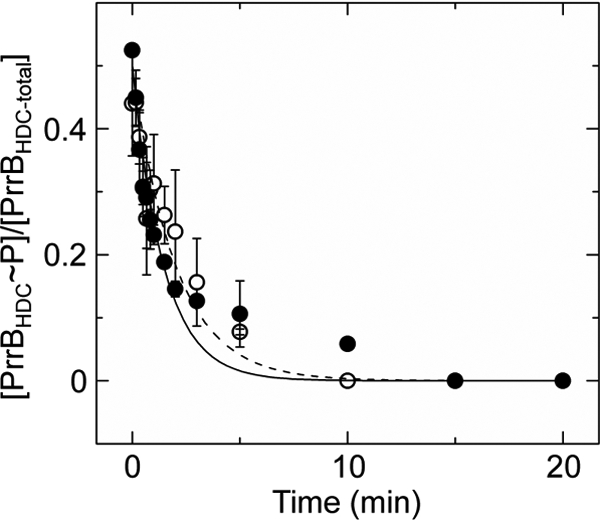
DNA-binding response regulators (RRs) of the OmpR/PhoB subfamily alternate between inactive and active conformational states, with the latter having enhanced DNA-binding affinity. Phosphorylation of an aspartate residue in the receiver domain, usually via phosphotransfer from a cognate histidine kinase, stabilizes the active conformation. Many of the available structures of inactive OmpR/PhoB family proteins exhibit extensive interfaces between the N-terminal receiver and C-terminal DNA-binding domains. These interfaces invariably involve the α4-β5-α5 face of the receiver domain, the locus of the largest differences between inactive and active conformations and the surface that mediates dimerization of receiver domains in the active state. Structures of receiver domain dimers of DrrB, DrrD, and MtrA have been determined, and phosphorylation kinetics were analyzed. Analysis of phosphotransfer from small molecule phosphodonors has revealed large differences in autophosphorylation rates among OmpR/PhoB RRs. RRs with substantial domain interfaces exhibit slow rates of phosphorylation. Rates are greatly increased in isolated receiver domain constructs. Such differences are not observed between autophosphorylation rates of full-length and isolated receiver domains of a RR that lacks interdomain interfaces, and they are not observed in histidine kinase-mediated phosphotransfer. These findings suggest that domain interfaces restrict receiver domain conformational dynamics, stabilizing an inactive conformation that is catalytically incompetent for phosphotransfer from small molecule phosphodonors. Inhibition of phosphotransfer by domain interfaces provides an explanation for the observation that some RRs cannot be phosphorylated by small molecule phosphodonors in vitro and provides a potential mechanism for insulating some RRs from small molecule-mediated phosphorylation in vivo.


Figures

REACTION 1
REACTION 1
FIGURE 1.
FIGURE 1.
Structures of DrrD, DrrB. and MtrA. A, ribbon depictions of full-length T. maritima DrrD and DrrB and M. tuberculosis MtrA (Protein Data Bank codes 1KGS, 1P2F, and 2GWR) presumed to be in inactive conformations. Surfaces (shown in white) illustrate differences in the extent of interdomain interfaces. B, ribbon depictions of the corresponding receiver domain dimers (Protein Data Bank codes 3NNS, 3NNN, and 3NHZ) with protomers colored blue and green. Structures of DrrD and DrrB receiver domains were determined in the presence of the phosphoryl analog BeF3, shown in ball-and-stick mode, and are presumed to be in active conformations. All structures are aligned relative to the blue receiver domain. Asp residues at the sites of phosphorylation and the conserved Thr and Tyr switch residues in the receiver domains are shown in ball-and-stick depictions. In full-length DrrB and MtrA, Asp residues in the effector domains that form hydrogen bonds with the conserved Tyr residues are also shown.
FIGURE 2.
FIGURE 2.
Dimer interfaces of MtrA and BeF3-activated DrrB receiver domains. A and B, ionic and hydrophobic interactions, respectively, at dimer interfaces. The α4-β5-α5 regions of two protomers (blue and green) are shown as ribbon depictions, with conserved charged residues that participate in intra- and/or intermolecular salt bridges (dashed lines) shown in stick format and hydrophobic residues involved in intermolecular contacts shown in spheres (carbons, blue and green; nitrogens, blue; oxygens, white). Tyr switch residues (white spheres) are oriented away from the interface in DrrB and form the central contact of the interface in MtrA. All dimers are aligned relative to the green protomer, illustrating the ∼50° rotation of the blue protomer around an axis perpendicular to the plane of the interface. C, conserved switch residues in DrrB and MtrA. Asp residues at the site of phosphorylation and conserved Thr and Tyr switch residues in inactive DrrB (blue), active DrrB (green), and MtrA (gold) are displayed on backbone traces of aligned receiver domains. Orientations of the Thr and Tyr residues in MtrA are similar to those observed in inactive receiver domains.
FIGURE 3.
FIGURE 3.
Autophosphorylation of DrrB, DrrD, and their isolated receiver domains. A, phosphoprotein affinity gel electrophoresis using Phos-tagTM acrylamide gel electrophoresis separation of DrrB∼P from DrrB and DrrBN∼P from DrrBN (upper and lower gels, respectively). B, similar gels depicting the separation of DrrD∼P from DrrD and DrrDN∼P from DrrDN (upper and lower gels, respectively). In both A and B, lanes 1–9 correspond to samples collected 0, 20, 40, 60, 90, 120, 300, 600, and 1200 s following the addition of PA. Each autophosphorylation reaction was performed with 10 μm RR and 20 mm PA in 50 mm Tris, 100 mm NaCl, 10 mm MgCl2, and 2 mm BME at pH 7.5. At the indicated time points, 15-μl aliquots were removed from the reaction solution and mixed with 5 μl of 4× SDS loading buffer (0.8% (w/v) SDS, 250 mm Tris (pH 6.8), 4% (v/v) glycerol, 0.08% (v/v) bromphenol blue, and 572 mm BME) to stop the reactions. C and D, plots of the corrected fraction of phosphorylated DrrB (●) and DrrBN (○) (C) and DrrD (●) and DrrDN (○) (D) versus incubation time with PA. In each plot, the fraction of phosphorylated protein from each time point was characterized using the average of at least three independent phosphoprotein affinity gel electrophoresis experiments, with error bars representing S.D. Solid and dashed lines depict the first-order exponential decay fit of the indicated points for the full-length and isolated receiver domains, respectively.
FIGURE 4.
FIGURE 4.
Rate of autodephosphorylation of DrrB, PrrA, and their isolated receiver domains. A and B, plots of the natural logarithm of the observed fraction of phosphorylated DrrB (●) and DrrBN (○) (A) and PrrA (●) and PrrAN (○) (B) at various times after removal of the phosphodonor (PA). Solid and dashed lines represent the best fit linear regression of the plots of the full-length RRs and isolated receiver domains, respectively. Each data point represents the average of two independent measurements, with error bars indicating S.D.
FIGURE 5.
FIGURE 5.
Rate of phosphotransfer from PrrBHDC to PrrA and PrrAN. Shown is a plot of the fraction of phosphorylated PrrBHDC observed at various time points following incubation with PrrA (●) or PrrAN (○). Solid and dashed lines depict the first-order exponential decay fits using PrrA and PrrAN as the phosphoacceptors, respectively. Each data point represents the average of at least two independent experiments, with error bars representing S.D.
FIGURE 6.
FIGURE 6.
Contribution of coupled conformational equilibria to the energetics of RR autophosphorylation reactions. The conformational change of a RR receiver domain from an unphosphorylatable (oval) to a phosphorylatable (starburst) conformation is a rate-limiting step in the RR autophosphorylation reaction. The energetic cost of this conformational change is modulated by RR interdomain interactions. Multiple interdomain orientations and strengths of interaction exist (represented by the dotted lines), with strength of the interdomain interaction correlating directly to the activation free energy (ΔG) of the reaction (dotted arrow). Note that the overall reaction has a favorable free energy change (ΔG° < 0) due to the hydrolysis of the small molecule phosphodonor.

Comment in

References

    1. Hoch J. A., Silhavy T. J. (eds) (1995) Two-component Signal Transduction, American Society for Microbiology Press, Washington, DC
    1. Stock A. M., Robinson V. L., Goudreau P. N. (2000) Annu. Rev. Biochem. 69, 183–215 - PubMed
    1. Gao R., Mack T. R., Stock A. M. (2007) Trends Biochem. Sci. 32, 225–234 - PMC - PubMed
    1. Volkman B. F., Lipson D., Wemmer D. E., Kern D. (2001) Science 291, 2429–2433 - PubMed
    1. Nohaile M., Kern D., Wemmer D., Stedman K., Kustu S. (1997) J. Mol. Biol. 273, 299–316 - PubMed

Publication types

MeSH terms

Substances

LinkOut - more resources