. 2010 Dec;38(22):8357-69.
doi: 10.1093/nar/gkq692. Epub 2010 Aug 11.

Structural basis for the bacterial transcription-repair coupling factor/RNA polymerase interaction

Affiliations

Structural basis for the bacterial transcription-repair coupling factor/RNA polymerase interaction

Lars F Westblade et al. Nucleic Acids Res. 2010 Dec.

Abstract

The transcription-repair coupling factor (TRCF, the product of the mfd gene) is a widely conserved bacterial protein that mediates transcription-coupled DNA repair. TRCF uses its ATP-dependent DNA translocase activity to remove transcription complexes stalled at sites of DNA damage, and stimulates repair by recruiting components of the nucleotide excision repair pathway to the site. A protein/protein interaction between TRCF and the β-subunit of RNA polymerase (RNAP) is essential for TRCF function. CarD (also called CdnL), an essential regulator of rRNA transcription in Mycobacterium tuberculosis, shares a homologous RNAP interacting domain with TRCF and also interacts with the RNAP β-subunit. We determined the 2.9-Å resolution X-ray crystal structure of the RNAP interacting domain of TRCF complexed with the RNAP-β1 domain, which harbors the TRCF interaction determinants. The structure reveals details of the TRCF/RNAP protein/protein interface, providing a basis for the design and interpretation of experiments probing TRCF, and by homology CarD, function and interactions with the RNAP.


Figures
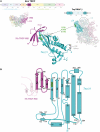
Figure 1.
Figure 1.
The TRCF–RID/RNAP-β1 complex. (A) Structural context of the TRCF–RID and the RNAP-β1 domains. (Upper left) The horizontal bar represents the 1148-residue Eco TRCF primary sequence (every 100 residues are marked below the bar). Structural domains are represented as thick, colored bars; thin black bars represent linkers connecting the domains (8). The RID is highlighted and colored magenta. Below the bar, a side view of the structure of repressed Eco TRCF (8) is shown as an α-carbon backbone, with the domains color-coded as in the bar above. The RID (Eco TRCF479–545, colored magenta) is highlighted with a transparent molecular surface. L499 is shown as pink CPK atoms; an L499R substitution at this position disrupts the TRCF–RID/RNAP protein/protein interaction (8). (Upper right) The horizontal bar represents the N-terminal 400 residues of the Taq RNAP β-subunit primary sequence (every 100 residues are marked below the bar). Structural domains are represented as thick, colored bars, thin black bars represent linkers connecting the domains (25,26). The two sequence elements comprising the β1 domain (β1a, residues 17–139, and β1b, residues 334–395), which flank the β2 domain, are highlighted and colored cyan. Below the bar, the β-side view of the structure of Taq core RNAP (26) is shown as an α-carbon backbone and with the subunits color-coded as follows: αI, αII, gray; β, pale cyan, except the β1 domain is cyan; β′, pale pink. The β1 domain is also highlighted with a transparent molecular surface. The β2 domain is also denoted. β residues I108, K109, and I110 are shown as green CPK atoms; substitutions at corresponding positions in the Eco RNAP β-subunit (Eco RNAP-βI117,K118,E119) cause defects in the TRCF/RNAP protein/protein interaction (8,14). (Middle) The structure of the Tth TRCF–RID/ Taq RNAP-β1 complex, shown as a ribbon diagram (Tth TRCF–RID, magenta; Taq RNAP-β1, cyan). In the TRCF–RID, the α-carbon of R341 is shown as a pink sphere; Tth TRCF–RIDR341 corresponds to Eco TRCF–RIDL499, which has been shown to be involved in the TRCF–RID/RNAP protein/protein interface (8). In the RNAP-β1, the α-carbons of I108, K109 and E110 are shown as green spheres; Taq RNAP-β1I108,K109,E110 correspond to Eco RNAP-β1I117,K118,E119, which have been shown to be involved in the TRCF–RID/RNAP protein/protein interface (8,14). The –Gly–Gly– linker, introduced into the construct to connect β1a and β1b, is colored grey and shown as α-carbon spheres. (B) Topology diagram of the Tth TRCF–RID/ Taq RNAP-β1 complex; α-helices are shown as rectangles, β-strands as arrows. The start- and end-residues for each secondary structural element are shown. The β-strands involved in the intermolecular β-sheet formed in the complex are numbered for each protein. The TRCF–RID is colored magenta, but β-strand 1 and β-strand 5, disordered in all four heterodimers of the crystallographic asymmetric unit, are shown in pink. The location of the interface residue R341 is shown as a pink circle. The RNAP-β1 domain is colored cyan. The locations of the interface residues I108, K109 and E110 are shown as green circles.
Figure 2.
Figure 2.
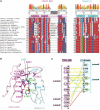
Sequence and structural features of the TRCF–RID/RNAP-β1 interface. (A) Sequence conservation in the TRCF–RID/RNAP-β1 interface. Sequences are shown in one-letter amino acid code and identified by species at the left. The numbers at the beginning of each line indicate amino acid positions relative to the start of each protein sequence. Residues involved in direct interprotein contacts in the TRCF–RID/RNAP-β1 interface are denoted by colored dots directly above the sequences. The locations of β-strands are denoted schematically above the sequences. The numbers above indicate the amino acid position in Tth TRCF and RNAP-β. Positions in the alignment that share >50% identity with the consensus are indicated by red shading, while positions that share >50% homology are indicated by blue shading. Homology groups are defined as: a, acidic (DE); b, basic (HKR); f, aliphatic (AGILV); m, amide (NQ); o, aromatic (FWY), h, hydroxyl (ST); i, imino (P); s, sulfur (CM). Shown at the very top is the consensus homology, and the strength of the homology shown in a histogram (tall red bar, 100% homologous, short blue bar, <20% homologous). The positions correlated between the TRCF–RID and RNAP-β1 are highlighted in cyan/green). If the position corresponding to Tth TRCF–RIDR341 is R, then the position corresponding to Tth RNAP-β1Q99 is Q or E (cyan). On the other hand, if the TRCF–RID residue is I, L, V, or E, then the RNAP-β1 residue is R (green). (B) Molecular structure of the TRCF–RID/RNAP-β1 interface. The TRCF–RID is shown as a pale pink backbone worm. Residues involved in direct contacts with RNAP-β1 are shown in stick format (nitrogen atoms, blue; oxygen, red; carbon, magenta, except R341 is pink). The RNAP-β1 is shown as a pale cyan backbone worm. Residues involved in direct contacts with the TRCF–RID are shown in stick format (nitrogen atoms, blue; oxygen, red; carbon, cyan, except I108, K109 and E110 are green). Polar contacts are shown as dashed lines (backbone–backbone hydrogen bonds, red; side-chain polar contacts, grey). (C) Schematic diagram illustrating TRCF–RID/RNAP-β1 intermolecular contacts: yellow lines, van der Waals contacts (<4 Å); green lines, hydrogen bonds (<3.2 Å); red lines, salt bridges/hydrogen bonds. Note that the TRCF–RID is shown with the C-terminus at the top, while the RNAP-β1 is shown with the N-terminus at the top.
Figure 3.
Figure 3.
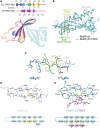
Structural comparisons. (A) Comparison of the Eco TRCF–RID (residues 479–545 from the Eco TRCF structure; (8), colored as a ramp from blue (N-terminus) to red (C-terminus), and the Tth TRCF–RID (colored magenta) from the TRCF–RID/RNAP-β1 complex. The secondary structure of the two proteins is shown in schematic form on top. Below, the superimposed TRCF–RID structures are shown as ribbon diagrams, color-coded as in the schematic. The Taq RNAP-β1 complexed with Tth TRCF–RID is also shown. (B) Comparison of the Taq RNAP-β1 domains from the Taq core RNAP (pale cyan) (26), and from the TRCF–RID/RNAP-β1 complex (cyan). The superimposed structures are shown as backbone worms. The α-carbons of the TRCF–RID interface residues I108, K109, and E110 are shown as spheres (RNAP, yellow; complex with TRCF–RID, green), illustrating the register shift. (C) Side view of RNAP-β1 residues 102–112 from the RNAP structure (pale cyan, but with I108/K109/E110 colored yellow) and from the TRCF–RID/RNAP-β1 structure (cyan, but with I108/K109/E110 colored green), illustrating the register shift. The structures were aligned over the entire β1 domain. (D) Top view of RNAP-β1 β-strand 3 and β-strand 4 from the RNAP structure. Backbone-backbone hydrogen bonding interactions are shown as dashed grey lines. Below is the same, shown as a schematic. The dark-colored triangles denote side chains that point away from the viewer, down into the plane of the page. The light-colored triangles denote side chains that point up towards the viewer, out of the plane of the page. (E) Top view of RNAP-β1 β-strand 3 and β-strand 4 from the TRCF–RID/RNAP-β1 structure. Also shown are TRCF–RID360–362 (magenta). Backbone-backbone hydrogen-bonding interactions are shown as dashed grey lines. Below is the same, shown as a schematic.
Figure 4.
Figure 4.
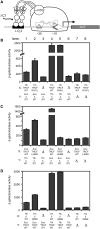
Bacterial two-hybrid analysis of the interaction between heterologous TRCF–RID and RNAP-β1 proteins. (A) Bacterial two-hybrid assay (23,45) used to study the interaction between the TRCF–RID and RNAP-β1 domains. Cartoon depicts how the interaction between protein domain X (fused to the N terminal domain of the RNAP α-subunit, α-NTD) and protein domain Y (fused to the bacteriophage λ CI protein) activates transcription from test promoter placOL262, which bears the λ operator OL2 centered 62-bp upstream of the start site of the lac core promoter. In reporter strain FW102 OL262, test promoter placOL262 is located on an F′ episome and drives the expression of a linked lacZ transcriptional fusion (8,45). (B–D). Results of β-galactosidase assays performed with FW102 OL262 cells containing two compatible plasmids, one encoding either α (Δ) or the indicated α fusion protein, and the other encoding λCI (Δ) or the indicated λCI fusion protein. The plasmids directed the synthesis of α, λCI, or the fusion proteins under the control of isopropyl-β-d-thiogalactoside (IPTG)-inducible promoters and the cells were grown in the presence of either 50 µM IPTG (B, D) or 20 µM IPTG (C). Plotted on the graphs are the mean and SEM of four (B), six (C) or 12 (D) independent measurements.

Similar articles

Cited by

References

    1. Bohr VA, Smith CA, Okumoto DS, Hanawalt PC. DNA repair in an active gene: removal of pyrimidine dimers from the DHFR gene of CHO cells is much more efficient than in the genome overall. Cell. 1985;40:359–369. - PubMed
    1. Mellon I, Hanawalt PC. Induction of the Escherichia coli lactose operon selectively increases repair of its transcribed DNA strand. Nature. 1989;342:95–98. - PubMed
    1. Selby CP, Sancar A. Transcription preferentially inhibits nucleotide excision repair of the template DNA strand in vitro. J. Biol. Chem. 1990;265:21330–21336. - PubMed
    1. Witkin EM. Time, temperature, and protein synthesis: a study of ultraviolet-induced mutation in bacteria. Cold Spring Harbor Symp. Quant. Biol. 1956;21:123–140. - PubMed
    1. Witkin EM. Radiation-induced mutations and their repair. Science. 1966;152:1345–1353. - PubMed

Publication types

MeSH terms

Substances

Associated data