. 2011 Jan 22;278(1703):298-306.
doi: 10.1098/rspb.2010.0590. Epub 2010 Aug 11.

A congruent solution to arthropod phylogeny: phylogenomics, microRNAs and morphology support monophyletic Mandibulata

Affiliations

A congruent solution to arthropod phylogeny: phylogenomics, microRNAs and morphology support monophyletic Mandibulata

Omar Rota-Stabelli et al. Proc Biol Sci. .

Abstract

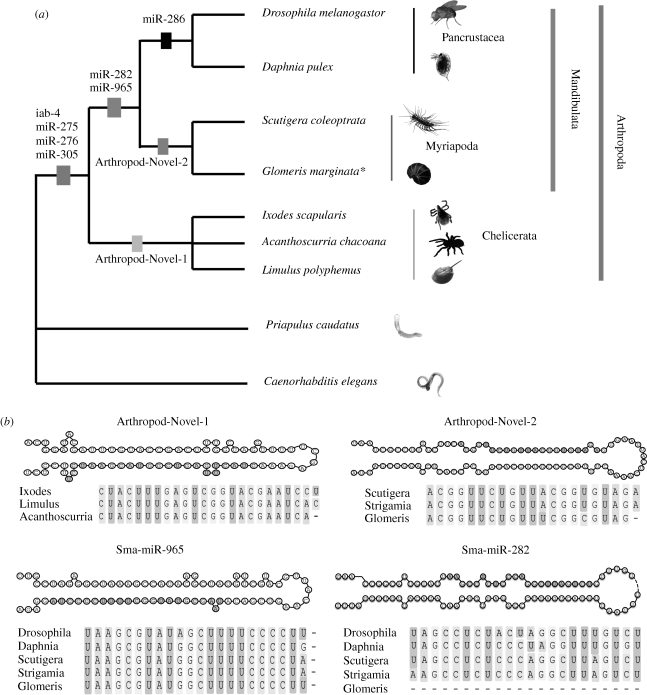
While a unique origin of the euarthropods is well established, relationships between the four euarthropod classes-chelicerates, myriapods, crustaceans and hexapods-are less clear. Unsolved questions include the position of myriapods, the monophyletic origin of chelicerates, and the validity of the close relationship of euarthropods to tardigrades and onychophorans. Morphology predicts that myriapods, insects and crustaceans form a monophyletic group, the Mandibulata, which has been contradicted by many molecular studies that support an alternative Myriochelata hypothesis (Myriapoda plus Chelicerata). Because of the conflicting insights from published molecular datasets, evidence from nuclear-coding genes needs corroboration from independent data to define the relationships among major nodes in the euarthropod tree. Here, we address this issue by analysing two independent molecular datasets: a phylogenomic dataset of 198 protein-coding genes including new sequences for myriapods, and novel microRNA complements sampled from all major arthropod lineages. Our phylogenomic analyses strongly support Mandibulata, and show that Myriochelata is a tree-reconstruction artefact caused by saturation and long-branch attraction. The analysis of the microRNA dataset corroborates the Mandibulata, showing that the microRNAs miR-965 and miR-282 are present and expressed in all mandibulate species sampled, but not in the chelicerates. Mandibulata is further supported by the phylogenetic analysis of a comprehensive morphological dataset covering living and fossil arthropods, and including recently proposed, putative apomorphies of Myriochelata. Our phylogenomic analyses also provide strong support for the inclusion of pycnogonids in a monophyletic Chelicerata, a paraphyletic Cycloneuralia, and a common origin of Arthropoda (tardigrades, onychophorans and arthropods), suggesting that previous phylogenies grouping tardigrades and nematodes may also have been subject to tree-reconstruction artefacts.


Figures

Figure 1.
Figure 1.
Phylogenomic analyses support Mandibulata, Arthropoda, Chelicerata and paraphyletic Cycloneuralia. Bayesian analyses using the CAT + Γ model. Values at nodes correspond to posterior probabilities (PP) (in italics) and bootstrap support (BS) from 100 pseudo-replicates (in bold); values in brackets are the BS for the same dataset reanalysed without the long branched Nematoda and Tardigrada lineages. Analyses support a monophyletic group of Mandibulata (Myriapoda, Hexapoda and Crustacea), a monophyletic group of Arthropoda (Eurthropoda, Tardigrada and Onychophora), monophyly of Chelicerata (Pycnogonida plus Euchelicerata) and a paraphyletic origin of the Cycloneuralia (Nematoda sister group of the Arthropoda). Where not shown, support values correspond to a PP of 1.00 and BS of 100 per cent. Images have been modified from http://commons.wikimedia.org.
Figure 2.
Figure 2.
Taxon sampling and the artefactual nature of Myriochelata. Phylogenetic analyses of our 198 gene dataset using different taxon samples and both Bayesian and maximum likelihood inference. (a) Use of the less well fitting WAG + F + Γ and GTR + Γ homogeneous models results in lower support for Mandibulata (black node and lineages) compared to the best fitting CAT + Γ model (figure 1). The tree depicted is from the Bayesian CAT + Γ analyses. (b) Phylogenetically distant Lophotrochozoa and (c) fast evolving Nematoda outgroups exert an LBA with the fast evolving Tetraconata lineage, thereby regrouping slow evolving Myriapoda and Chelicerata (Myriochelata) (d) When using slowly evolving and phylogenetically close ecdysozoan outgroups, the support for Mandibulata increases. Trees b, c and d are the WAG + F + Γ maximum likelihood trees. Note that support for Mandibulata is high regardless of which outgroup is used when the dataset is analysed using best fitting model CAT + Γ, but significantly varies when using the less well fitting WAG + F + Γ and GTR + Γ models. Values at nodes are PPs from the Bayesian analyses using CAT + Γ model (PP in italics) BS from 100 replicates using the WAG + F + Γ (BS plain text) and GTR + Γ (BS in bold text) models. When not shown, the support is PP 1.00 and BS 100 per cent. Lineages have been collapsed for clarity with the length of triangles equal to the longest terminal branch in the collapsed lineage and stems are equal to the original length. Original trees with full support values are indicated in the electronic supplementary material, figure S3.
Figure 3.
Figure 3.
Support for Mandibulata from the gene set of Dunn et al. [12]. Bayesian and maximum likelihood analyses of the dataset of Dunn et al. [12]. (a) Using their original set of genes and taxa, Myriochelata is recovered with high support. (b) Using our taxon sampling (with the key addition of additional myriapod data) support for Myriochelata decreases and limited support for Mandibulata is recovered. (c) Support for Mandibulata increases when fast evolving or distant outgroups are excluded. Tree topologies correspond to the whole dataset Bayesian CAT + Γ trees. Values at nodes are PPs from the Bayesian analyses using CAT + Γ model (in italics and underscored) BS from 100 replicates using the WAG + F + Γ (plain text) and GTR + Γ (bold text) models. When not shown, the support is PP 1.00 and BS 100 per cent. Lineages have been collapsed for clarity with the length of triangles equal to the longest terminal branch in the collapsed lineage and stems are equal to the original length. Original trees with full support values are shown in the electronic supplementary material, figure S4.
Figure 4.
Figure 4.
miRNAs corroborate the monophyly of Mandibulata. (a) The monophyly of Mandibulata is supported by the presence of miR-965 and miR-282, also discovered in the genome of the centipede Strigamia maritima, and in the small RNA libraries of the millipede Glomeris marginata and the house centipede Scutigera coleoptrata. miR-965 and miR-282 are not known from any chelicerate or non-arthropod. N.B. miR-282 was not found in the small RNA library of Glomeris. (b) In addition a novel chelicerate miRNA (Arthropod-Novel-1) is present only in chelicerates, but in none of the mandibulates considered, and a novel myriapod miRNA (Arthropod-Novel-2) is found only in myriapods. Shaded residues highlight the mature miRNA sequence within the folded pre-miRNAs.
Figure 5.
Figure 5.
Morphology supports monophyly of crown Mandibulata. Summary cladogram of crown group euarthropod relationships based on morphological data (393 characters listed in the electronic supplementary material). Clades shown here are a strict consensus of shortest cladograms computed by TNT and PAUP*. Numbers to left of branches are Bremer support values; for extant taxa, values for analyses with (left) and without fossils (right) are separated by a slash. Numbers to right of branches are bootstrap (top) and jackknife (bottom) frequencies (indicated by a dash if less than 50%); values for analysis with and without fossils are separated by a slash. The fossils Tanazios, Martinssonia, and trilobites (Olenoides) are resolved progressively more stemward relative to the mandibulate crown group.

References

    1. Telford M. J., Bourlat S. J., Economou A. D., Papillon D., Rota-Strabelli O. 2008. The evolution of the Ecdysozoa. Phil. Trans. R. Soc. B 363, 1529–153710.1098/rstb.2007.2243 (doi:10.1098/rstb.2007.2243) - DOI - DOI - PMC - PubMed
    1. Edgecombe G. D. 2010. Arthropod phylogeny: an overview from the perspectives of morphology, molecular data and the fossil record. Arthropod Struct. Dev. 39, 74–8710.1016/j.asd.2009.10.002 (doi:10.1016/j.asd.2009.10.002) - DOI - DOI - PubMed
    1. Budd G. E., Telford M. J. 2009. The origin and evolution of arthropods. Nature 417, 812–81710.1038/nature07890 (doi:10.1038/nature07890) - DOI - DOI - PubMed
    1. Nielsen C. 1995. Animal evolution. Interrelationships of the living phyla, 2nd edn. Oxford, UK: Oxford University Press
    1. Telford M. J., Thomas R. H. 1995. Demise of the Atelocerata? Nature 376, 123–12410.1038/376123a0 (doi:10.1038/376123a0) - DOI - DOI

Publication types

LinkOut - more resources