. 2010 Oct;24(10):1988-97.
doi: 10.1210/me.2010-0115. Epub 2010 Aug 11.

Endogenous activation of glucokinase by 6-phosphofructo-2-kinase/fructose-2,6-bisphosphatase is glucose dependent

Affiliations

Endogenous activation of glucokinase by 6-phosphofructo-2-kinase/fructose-2,6-bisphosphatase is glucose dependent

Sara Langer et al. Mol Endocrinol. 2010 Oct.

Abstract

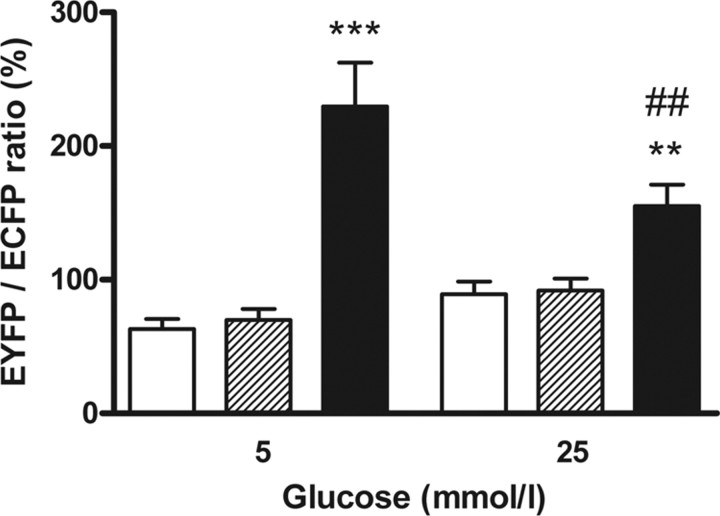
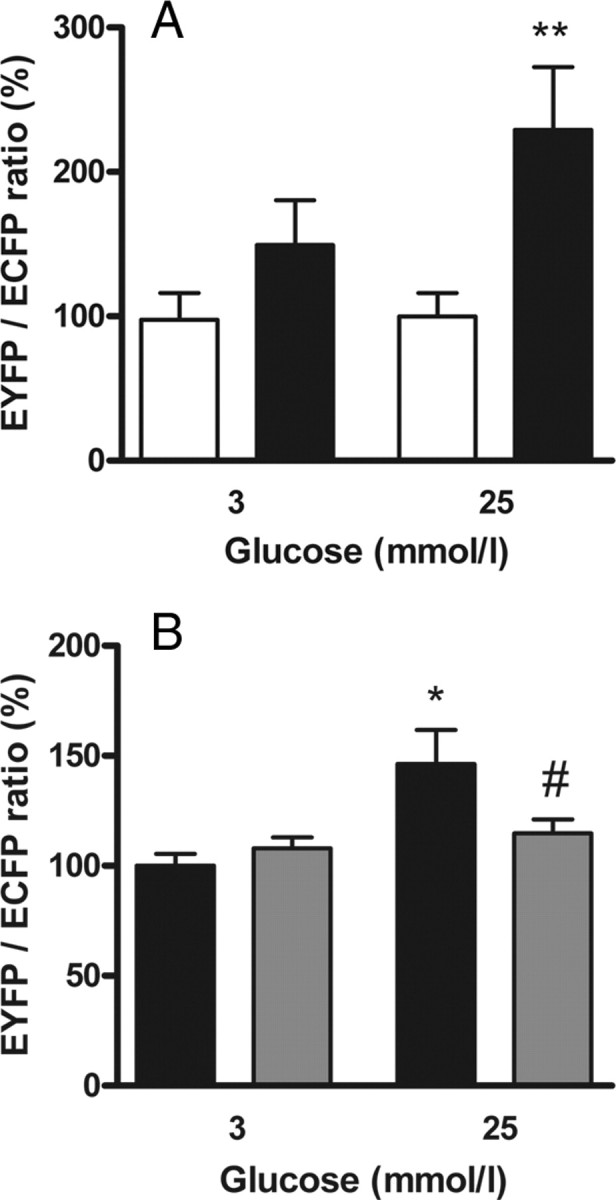
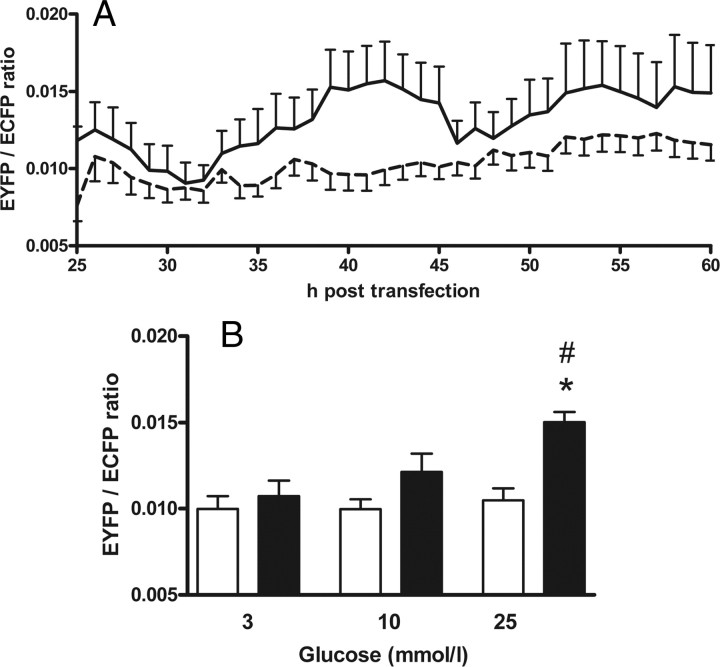
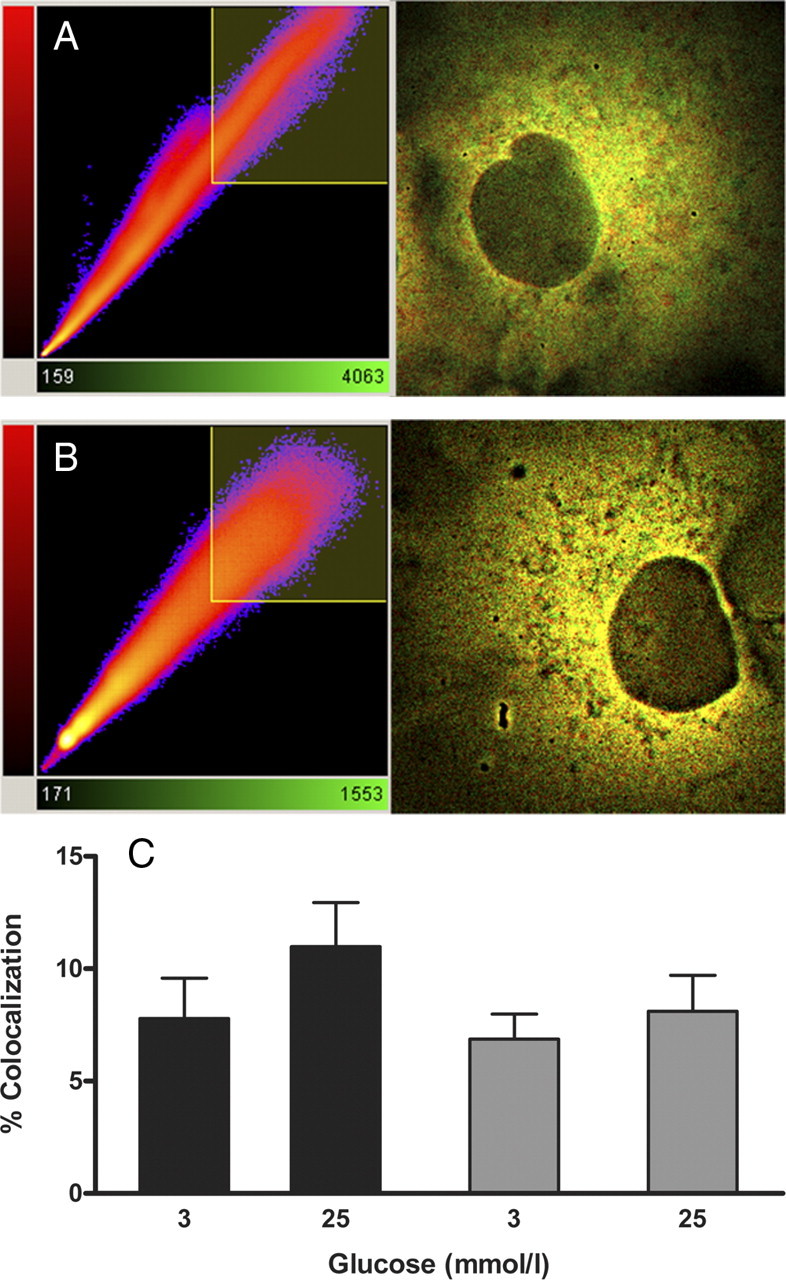
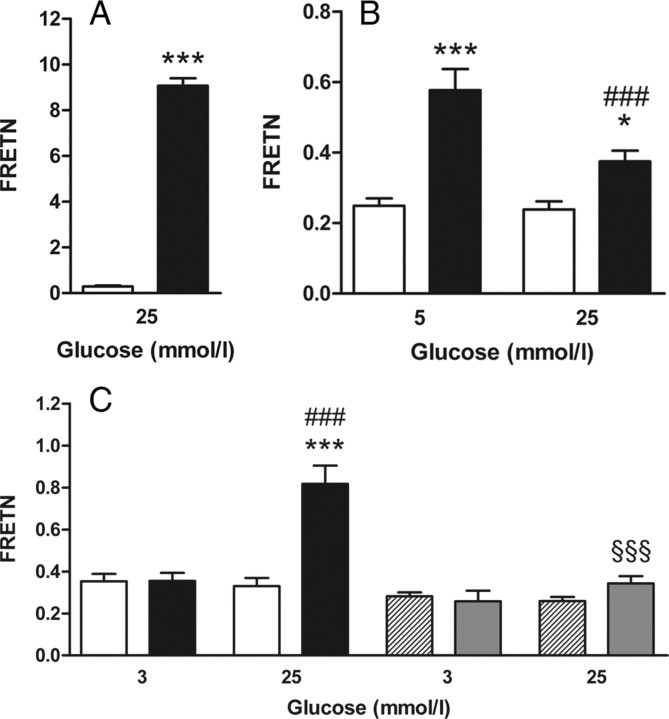
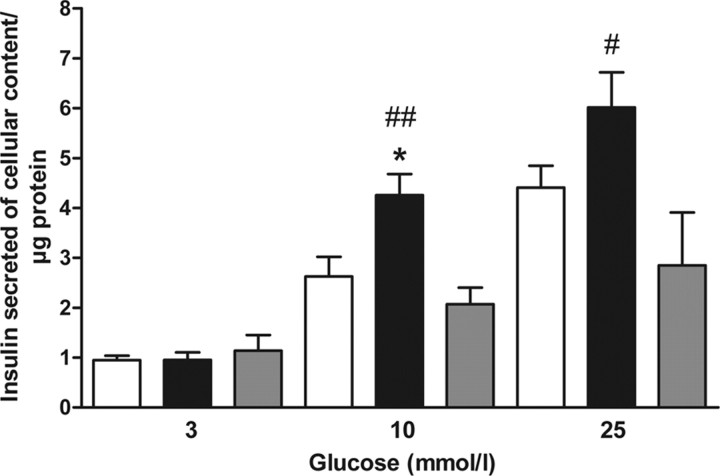
Glucokinase (GK) plays a crucial role as glucose sensor in glucose-induced insulin secretion in pancreatic β-cells. The bifunctional enzyme 6-phosphofructo-2-kinase/fructose-2,6-bisphosphatase (PFK-2/FBPase-2) acts as an endogenous GK activator. Therefore, the goal of this study was the analysis of GK-PFK-2/FBPase-2 complex formation and its effect on metabolic stimulus-secretion coupling in β-cells in dependence upon glucose. The interaction between GK and PFK-2/FBPase-2 was analyzed in insulin-secreting MIN6 cells with a new fluorescence-based mammalian two-hybrid system. In contrast to the commonly used mammalian two-hybrid systems that require sampling before detection, the system used allows monitoring of the effects of environmental changes on protein-protein interactions on the single-cell level. Increasing the glucose concentration in the cell culture medium from 3 to 10 and 25 mmol/liter amplified the interaction between the enzymes stepwise. Importantly, in line with these results, overexpression of PFK-2/FBPase-2 in MIN6 cells evoked only at 10 and 25 mmol/liter, an increase in insulin secretion. Furthermore, a PFK-2/FBPase-2 mutant with an abolished GK-binding motif neither showed a glucose-dependent GK binding nor was able to increase insulin secretion. The results obtained with the mammalian two-hybrid system could be confirmed by fluorescence resonance energy transfer experiments in COS cells. Furthermore, the established interaction between GK and the liver GRP served in all experiments as a control. Thus, this study clearly showed that binding and activation of GK by PFK-2/FBPase-2 in β-cells is promoted by glucose, resulting in an enhancement of insulin secretion at stimulatory glucose concentrations, without affecting basal insulin secretion.


Figures

Fig. 1.
Fig. 1.
Glucose-dependent modulation of GK binding to the GRP. The interaction strength of the fusion proteins DNA-BD-GRP and AD-GK was measured in a fluorescence-based mammalian two-hybrid assay. DNA-BD and AD-GK (white bars) or DNA-BD-GRP and AD (dashed bars) or DNA-BD-GRP and AD-GK (black bars) were coexpressed in COS cells. The cells were preincubated in the presence of 5 mmol/liter or 25 mmol/liter glucose. Thereafter, the fluorescence intensities of ECFP and EYFP were determined. Data are expressed as means ± sem of three to five individual experiments with a total of 142–266 nuclei analyzed. **, P < 0.01; ***, P < 0.001 compared with negative controls; ##, P < 0.01 compared with cells incubated with 5 mmol/liter glucose (ANOVA/Bonferroni’s test).
Fig. 2.
Fig. 2.
Glucose promoted binding of islet PFK-2/FBPase-2 to GK. The interaction strength of the fusion proteins DNA-BD-PFK-2/FBPase-2 or DNA-BD-PFK-2/FBPase-2-Mut and AD-GK was measured in a fluorescence-based mammalian two-hybrid assay in insulin-secreting MIN6 cells. A, DNA-BD-PFK-2/FBPase-2 and AD (white bars) or DNA-BD-PFK-2/FBPase-2 and AD-GK (black bars) were coexpressed in MIN6 cells and preincubated with 3 mmol/liter or 25 mmol/liter glucose. Thereafter, the fluorescence intensities for ECFP and EYFP were determined. Data are expressed as means ± sem of three individual experiments with a total of 60–70 nuclei analyzed. **, P < 0.01 compared with negative control (ANOVA/Bonferroni’s test). B, DNA-BD-PFK-2/FBPase-2 and AD-GK (black bars) or DNA-BD-PFK-2/FBPase-2-Mut and AD-GK (gray bars) were coexpressed in MIN6 cells and preincubated with 3 mmol/liter or 25 mmol/liter glucose. Thereafter, the fluorescence intensities for ECFP and EYFP were determined. Data are expressed as means ± sem of three individual experiments with a total of 44–152 nuclei analyzed. *, P < 0.05 compared with cells incubated with 3 mmol/liter glucose; #, P < 0.05 compared with DNA-BD-PFK-2/FBPase-2 wild type (ANOVA/Bonferroni’s test).
Fig. 3.
Fig. 3.
The interaction strength between GK and PFK-2/FBPase-2 rises with increasing glucose concentrations. The interaction of the fusion proteins DNA-BD-PFK-2/FBPase-2 and AD-GK was measured in a semiautomated fluorescence-based mammalian two-hybrid assay. DNA-BD-PFK-2/FBPase-2 and AD (dashed line in A and white bars in B) or DNA-BD-PFK-2/FBPase-2 and AD-GK (solid line in A and black bars in B) were coexpressed in insulin-secreting MIN6 cells. In cells cultured at 3, 10, or 25 mmol/liter glucose, respectively, the degree of interaction between DNA-BD and AD proteins was analyzed every hour as the mean value for the nuclear EYFP/ECFP ratio. A, Images were taken hourly over a period of 40 h. The time lapse of the calculated EYFP/ECFP ratio is exemplary, shown for a representative single experiment for the interaction of GK with islet PFK-2/FBPase-2 at 25 mmol/liter glucose (solid line) together with the respective negative control at 25 mmol/liter glucose (dashed line). Data are expressed as means ± sem of 2–120 nuclei analyzed per time point. B, The mean nuclear EYFP/ECFP ratios obtained between 36 and 48 h after transfection were determined together with the respective sem for 341–1369 cells per sample. The means ± sem of the EYFP/ECFP ratio are shown for three to five independent experiments with a total of 1331–5905 nuclei analyzed. *, P < 0.05 compared with negative control, #, P < 0.05 compared with cells incubated with 3 mmol/liter glucose (ANOVA/Bonferroni’s test).
Fig. 4.
Fig. 4.
Effect of low vs. high glucose on colocalization between GK and islet PFK-2/FBPase-2. ECFP-GK and EYFP-PFK-2/FBPase-2 or EYFP-PFK-2/FBPase-2-Mut fusion proteins were co-overexpressed in COS cells and precultured in medium containing 3 mmol/liter or 25 mmol/liter glucose, respectively. Fluorescence images were taken, and the degree of colocalization was calculated with the Imaris software (Bitplane). A typical image overlay of one cell co-overexpressing ECFP-GK and EYFP-PFK-2/FBPase-2 incubated at 3 mmol/liter glucose (A) and one at 25 mmol/liter glucose (B) is shown with the associated correlation diagram. ECFP-GK is depicted in green and EYFP-PFK-2/FBPase-2 is shown in red. C, Colocalization of ECFP-GK and EYFP-PFK-2/FBPase-2 (black bars), and of ECFP-GK and EYFP-PFK-2/FBPase-2-Mut (gray bars) is expressed as means ± sem of three individual experiments with a total of five to eight cells analyzed.
Fig. 5.
Fig. 5.
Effect of low vs. high glucose on FRET between GK and its binding partners GRP and islet PFK-2/FBPase-2. Fluorescent proteins were coexpressed in COS cells and precultured with the indicated glucose concentrations. Thereafter, fluorescence images were taken in living cells, and the sensitized emission-based FRET efficiency (FRETN) was calculated from the ECFP and EYFP emission intensities. A, FRETN between separately expressed ECFP and EYFP (white bars) or the fluorescent fusion protein ECFP-EYFP (black bars). B, FRETN between EYFP-GRP and ECFP (white bars) or ECFP-GK (black bars). C, FRETN between EYFP-PFK-2/FBPase-2 and ECFP (white bars) or ECFP-GK (black bars), and between EYFP-PFK-2/FBPase-2-Mut and ECFP (dashed bars) or ECFP-GK (gray bars). Data are expressed as means ± sem of three individual experiments with a total of 8–22 cells analyzed. *, P < 0.05; ***, P < 0.001 compared with negative control; ###, P < 0.001 compared with cells incubated with 3 mmol/liter or 5 mmol/liter glucose; §§§, P < 0.001 compared with EYFP-PFK-2/FBPase-2 wild type, respectively (panel A, Student’s t test; panels B and C, ANOVA/Bonferroni’s test).
Fig. 6.
Fig. 6.
Effect of islet PFK-2/FBPase-2 on glucose-induced insulin secretion. Insulin-secreting MIN6 cells were transfected with EYFP (white bars), EYFP-PFK-2/FBPase-2 (black bars), or EYFP-PFK-2/FBPase-2-Mut (gray bars) and cultured for 48 h. Cells were starved for 1 h and thereafter stimulated for 1 h with 3, 10, or 25 mmol/liter glucose, respectively. Insulin secretion is shown as insulin secreted per cellular insulin content and protein. Data are expressed as means ± sem of four individual experiments. *, P < 0.05 compared with negative control; #, P < 0.05; ##, P < 0.01 compared with EYFP-PFK-2/FBPase-2-Mut stimulated with the same glucose concentration (ANOVA/Bonferroni’s test).

References

    1. Baltrusch S, Tiedge M2006. Glucokinase regulatory network in pancreatic β-cells and liver. Diabetes 55(Suppl 2):S55–S64
    1. Lenzen S, Panten U1988. Signal recognition by pancreatic B-cells. Biochem Pharmacol 37:371–378 - PubMed
    1. Matschinsky F, Liang Y, Kesavan P, Wang L, Froguel P, Velho G, Cohen D, Permutt MA, Tanizawa Y, Jetton TL, Niswender K, Magnuson MA1993. Glucokinase as pancreatic β cell glucose sensor and diabetes gene. J Clin Invest 92:2092–2098 - PMC - PubMed
    1. Meglasson MD, Matschinsky FM1984. New perspectives on pancreatic islet glucokinase. Am J Physiol 246:E1–E13 - PubMed
    1. Matschinsky FM1996. Banting Lecture 1995. A lesson in metabolic regulation inspired by the glucokinase glucose sensor paradigm. Diabetes 45:223–241 - PubMed

Publication types