. 2010 Oct 1;21(19):3279-92.
doi: 10.1091/mbc.E10-05-0470. Epub 2010 Aug 11.

Small molecule inhibition of HIV-1-induced MHC-I down-regulation identifies a temporally regulated switch in Nef action

Affiliations

Small molecule inhibition of HIV-1-induced MHC-I down-regulation identifies a temporally regulated switch in Nef action

Jimmy D Dikeakos et al. Mol Biol Cell. .

Abstract

HIV-1 Nef triggers down-regulation of cell-surface MHC-I by assembling a Src family kinase (SFK)-ZAP-70/Syk-PI3K cascade. Here, we report that chemical disruption of the Nef-SFK interaction with the small molecule inhibitor 2c blocks assembly of the multi-kinase complex and represses HIV-1-mediated MHC-I down-regulation in primary CD4(+) T-cells. 2c did not interfere with the PACS-2-dependent trafficking of Nef required for the Nef-SFK interaction or the AP-1 and PACS-1-dependent sequestering of internalized MHC-I, suggesting the inhibitor specifically interfered with the Nef-SFK interaction required for triggering MHC-I down-regulation. Transport studies revealed Nef directs a highly regulated program to down-regulate MHC-I in primary CD4(+) T-cells. During the first two days after infection, Nef assembles the 2c-sensitive multi-kinase complex to trigger down-regulation of cell-surface MHC-I. By three days postinfection Nef switches to a stoichiometric mode that prevents surface delivery of newly synthesized MHC-I. Pharmacologic inhibition of the multi-kinase cascade prevents the Nef-dependent block in MHC-I transport, suggesting the signaling and stoichiometric modes are causally linked. Together, these studies resolve the seemingly controversial models that describe Nef-induced MHC-I down-regulation and provide new insights into the mechanism of Nef action.


Figures
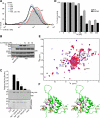
Figure 1.
Figure 1.
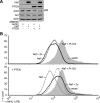
2c interferes with Nef:SFK binding. (A) H9 CD4+ T-cells were nucleofected (Amaxa) on days 1 and 3 with pmaxGFP and nonspecific siRNA or siRNAs that target Hck, Lyn, or Src alone or in combination. On day 4 cells were infected with VV:WT (gray filled) or VV:Nef (lines, unfilled) (moi = 10, 8 h), and analyzed by flow cytometry using mAb W6/32 as described in experimental procedures. MFI: NS siRNA (WT = 167, Nef = 99.5); Nef + Hck siRNA = 120; + Lyn siRNA = 103; + Src siRNA = 117; + Hck, Lyn, Src = 169. MFI, mean fluorescence intensity. (B) H9 cells were coinfected with VV:WT, VV:Nef/f or NefAXXA/f (moi = 10, 8 h) and VV:Hck (moi = 2, 8 h) and treated with 10, 20, or 50 μM 2c for 4 h before harvest. Nef/f proteins were immunoprecipitated, and coprecipitating Hck was detected by Western blot. (C) GST-Nef was incubated with His6-Hck and treated with increasing concentrations of 2c. GST-Nef was captured, and bound His6-Hck was quantified using NIH Image J. Accordingly, nonspecific binding of GST to His6-Hck was subtracted and values were normalized to the binding of GST-Nef to His6-Hck in the absence of 2c. Each condition was assayed in triplicate, and results are presented as the mean ± SD. (D) Hck alone (gray bars) or Hck plus Nef (black bars) were treated with increasing concentrations of 2c. The resulting Hck enzyme activity was measured using a fluorometric assay and expressed relative to 100% control activity. Each condition was assayed in quadruplicate and results are presented as the mean ± SD. (E) Superposition of 1H-15N HSQC spectra of Nef in the absence (blue) and presence (red) of 2c. The 1H-15N HSQC spectra were recorded on 80 μM uniform 15N-labeled Nef samples at 27°C in the absence (blue) and presence (red) of 1 mM 2c (1:12.5 M ratio of Nef to 2c). All assignable amide resonances (J. Jung, I.-J.L. Byeon, J. Ahn, and A.M. Gronenborn, unpublished data) that exhibit chemical shift changes >0.06 ppm are labeled with residue name and number. The resonances of Y135, V146, and F185 are labeled only on the free Nef spectrum because the identification of the bound resonances was not straightforward either due to very large shift changes or severe line broadening beyond detection. The resonances of M79 (Δδ = 0.041ppm) and T80 (Δδ = 0.025ppm), which are located immediately after the P72XXP75 motif, are also labeled. Concentrations of 2c as low as 48 μM, representing a 1:0.6 M ratio of Nef to 2c, revealed chemical shift changes between 15N-Nef and 2c. (F) Structural mapping of the chemical shift changes in the 1H-15N HSQC spectrum of Nef induced by 2c onto the Nef NMR structure (PDB ID: 2NEF, see (Grzesiek et al., 1997)). The 1H-15N-combined chemical shift changes were calculated using ΔδHN2+(ΔδN×0.1)2, with ΔδHN and ΔδN the 1HN and 15N chemical shift differences, respectively, between the free and 2c-bound Nef protein spectrum. On a stereoview of the structure in ribbon representation, sidechains of residues whose amide resonances exhibit significant changes are shown in stick representation and color coded according to the size of the change: orange; 0.06–0.1 ppm, and red; >0.1 ppm. Residues whose 1H-15N HSQC amide resonances are only detectable/assignable in free Nef are colored in magenta and the sidechains of the two prolines in the P72XXP75 region are shown in green.
Figure 2.
Figure 2.
2c represses HIV-1-induced down-regulation of MHC-I but not CD4. (A) H9 cells expressing eYFP (vector) or Nef-eYFP (Nef) for 24 h were treated or not with 20 μM 2c (Nef + 2c) or 5 μM of the class I PI3K inhibitor, PI-103 (Nef + PI-103) for another 16 h. At 40 h, cultures were analyzed by flow cytometry using W6/32. MFI: vector = 479, Nef = 208, Nef + 2c = 312, Nef + PI-103 = 444. Inset: Western blot showing expression of Nef-eYFP and actin. (B) Parallel cultures of primary CD4+ T-cells were infected with HIV-1NL4-3 and treated or not with 20 μM 2c at days 5 and 7 postinfection. At 8 d postinfection the cells were stained with p24-FITC, BB7.2, and CD4-APC and then analyzed for down-regulation of HLA-A2 (top) and CD4 (bottom) by flow cytometry as described in Methods. MHC-I MFI: uninfected = 518, HIV = 193, HIV + 2c = 301. CD4 MFI: uninfected = 413, HIV = 25.1, HIV + 2c = 25.2. Inset: Western blot showing expression of Nef and actin.
Figure 3.
Figure 3.
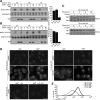
2c blocks the ability of Nef to assemble the multi-kinase complex. (A) H9 cells were infected with VV:WT, VV:NefAXXA/f, or VV:Nef/f (moi = 10, 8 h) and treated with 40 or 100 μM 2c for 4 h (which showed no toxicity in this time frame, supplemental Figure S3, b and c). Nef/f was immunoprecipitated and Nef-associated class I PI3K p85 regulatory subunit was detected by Western blot, and associated PI3K activity was measured using an in vitro lipid kinase assay as described in Methods. As controls, 40 μM 2c and 1 μM PI-103 were incubated with the eluted fraction for 10 min before kinase assay (in vitro samples). Each assay was measured in triplicate and results are presented as the mean ± SD. (B) Left: H9 cells were coinfected with VV:WT, VV:NefAXXA/f, or VV:Nef/f (moi = 6, 8 h) and VV:ZAP70 (moi = 4, 8 h). Nef/f was immunoprecipitated and coprecipitating Hck, phospho-ZAP-70 and p85 were detected by Western blot. Right: The amount of each Nef-associated kinase was quantified with Image J and presented numerically as the relative amount of Nef-associated kinase ± 20 μM 2c. Error bars represent the mean ± SD from 3 independent experiments. (C) H9 cells were coinfected with VV:Nef/f (moi = 6, 8 h) and VV:PACS-2 (moi = 4, 8 h) and treated with 40 or 100 μM 2c for 4 h before harvest. Nef/f was immunoprecipitated and coprecipitating PACS-2 was detected by Western blot. (D) Upper: HeLa cells expressing Nef-eYFP together with a control siRNA (NS) or PACS-2 siRNA (Western blot of siRNA knockdown shown at bottom). Lower: HeLa cells expressing Nef-eYFP were treated with 20 μM 2c for 16 h. Cells were stained with anti-Golgin 97 (red) and visualized by confocal microscopy (scale bar, 10 μm). Morphometric analysis was performed as described in Methods. Error bars are presented as the mean ± SD from at least 20 cells per condition and three independent experiments.
Figure 4.
Figure 4.
PACS-1 and AP-1 are required downstream of the 2c-sensitive multi-kinase complex. (A) Left: H9 cells were nucleofected with pmaxGFP together with a control siRNA (NS) or siRNAs specific for PACS-1, PACS-2, or μ1A. After 48 h, cells were infected with VV:WT, VV:Nef, or VV:NefAXXA-P13K* (moi = 10, 5 h). Cells were incubated with W6/32 (3 μg/ml) for 30 min, chased for an additional 30 min, then incubated with 0.5% acetic acid (pH 3.0) in 0.5M NaCl to remove surface antibody, fixed, and processed for immunofluorescence microscopy. Scale bar, 10 μm. Right: A portion of the cells from left were analyzed by Western blot for extent of siRNA knockdown. (B) H9 cells were coinfected with VV:Nef/f (moi = 6, 8 h) and VV:PACS-1 (moi = 4, 8 h) and treated with 40 or 100 μM 2c for 4 h before harvest. Nef/f was immunoprecipitated, and coprecipitating PACS-1 was analyzed by western blot. (C) Left: GST-MHC-I CDNefLL/AA or GST was mixed with A7 cell lysate, treated with 20 μM 2c, and captured g or 1μA subunits of AP-1 detected by Western blot. Right: Lysates from A7 cells expressing HA-tagged PACS-1 or PACS-2 were incubated with GST-MHC-I CDNefLL/AA or GST, treated with 20 μM 2c, and bound PACS proteins detected by Western blot. (D) H9 cells were treated or not with 20 μM 2c for 18 h and then infected with VV:WT, VV:Nef, VV:NefAXXA, or VV:NefAXXA-P13K* (moi = 10, 5 h). Cells were incubated with W6/32 (3 μg/ml) for 30 min and then chased for an additional 30 min and processed for immunofluorescence microscopy as described in the legend to panel A. Scale bar, 10 μm.
Figure 5.
Figure 5.
CEM cells do not model primary CD4+ T-cells in Nef action. (A) Western blot analysis of PI3K-dysregulated CEM cells rescued or not for PTEN. (B) Top: CEM cells expressing eYFP (vector) or Nef-eYFP (Nef) were treated or not with 20 μM 2c (Nef + 2c) for 16 h before analysis or 1 μM PI-103 (Nef + PI-103) for 3 h before analysis in media containing 0.5 mM ß-mercaptoethanol. Cells were analyzed by flow cytometry using W6/32 as described in Methods. MFI: vector = 425, Nef = 125, Nef + 2c = 123, Nef + PI-103 = 128. Bottom: CEM cells expressing PTEN with either eYFP (vector) or Nef-eYFP (Nef) were processed as described above. MFI: vector = 384, Nef = 94.6, Nef + 2c = 232, Nef + PI-103 = 162.
Figure 6.
Figure 6.
Nef-induced MHC-I down-regulation switches from a signaling to a stoichiometric mechanism. (A) H9 cells infected with Nef or Nef+ pseudotyped HIV-1NL4-3 viruses (moi = 2.3) for 24, 48, or 72 h and subjected to pulse-chase/surface biotinylation using HC10 associated MHC-I and quantified as described in Methods. Error bars represent the mean ± SD from 3 independent experiments. Cell viability was greater than 95% at each time point as measured by trypan blue exclusion and greater than 90% of the cells were infected with each virus as determined by GFP staining. (B) Primary CD4+ T-cells were processed and quantified as in panel A except using BB7.2 to IP native MHC-I. (C) H9 cells were infected with Nef or Nef+ pseudotyped HIV-1NL4-3 viruses for 24 or 72 h, MHC-I was immunoprecipitated with mAb HC10 as in A and then digested or not with Endo H as described in Methods. (D) H9 cells were infected with Nef or Nef+ pseudotyped HIV-1NL4-3 viruses for 48 or 72 h and then treated or not with PI-103 (5 μM) or 2c (20 μM) for 16 h. Cells were incubated with W6/32 (3 μg/ml) for 30 min and then chased and processed for immunofluorescence microscopy as described in the legend to Figure 4A. Post-fix: Total MHC-I was detected post-fixation by staining the cells with K455. Scale bar, 10 μm. (E) H9 cells were infected with Nef or Nef+ pseudotyped HIV-1NL4-3 viruses for 48 or 72 h and analyzed for down-regulation of MHC-I as described in Methods. MFI: 48 h Nef = 341, 48 h Nef+ = 110, 72 h Nef = 302, 72 h Nef+ = 125.
Figure 7.
Figure 7.
The PI3K signaling pathway is required for stoichiometric inhibition of MHC-I. (A) H9 cells were infected with Nef or Nef+ pseudotyped HIV-1NL4-3 viruses for a total of 72 h and either left untreated (control) or pre-treated with 20 μM 2c for 48 h (2c 48 h) or 24 h (2c 24 h) before analysis at 72 h postinfection. The cells were then subjected to pulse-chase/surface biotinylation as described in Methods. The amount of HC10 associated MHC-I delivered to the cell surface was quantified as described in Methods. Error bars are presented as the mean ± SD from three independent experiments. (B) H9 cells were infected as above and left untreated (control) or pretreated with 5 μM PI-103 for 48 h (PI-103 48 h) or 24 h (PI-103 24 h) before analysis at 72 h postinfection and then processed as in panel A. The amount of MHC-I delivered to the cell surface was quantified as described in Methods. Error bars are presented as the mean ± SD from three independent experiments. (p/c), cells treated with 20 μM 2c (A) or 10 μM PI-103 (B) during the pulse-chase only.

Similar articles

Cited by

References

    1. Alexaki A., Liu Y., Wigdahl B. Cellular reservoirs of HIV-1 and their role in viral persistence. Curr. HIV Res. 2008;6:388–400. - PMC - PubMed
    1. Arold S., Franken P., Strub M. P., Hoh F., Benichou S., Benarous R., Dumas C. The crystal structure of HIV-1 Nef protein bound to the Fyn kinase SH3 domain suggests a role for this complex in altered T cell receptor signaling. Structure. 1997;5:1361–1372. - PubMed
    1. Astoul E., Edmunds C., Cantrell D. A., Ward S. G. PI 3-K and T-cell activation: limitations of T-leukemic cell lines as signaling models. Trends Immunol. 2001;22:490–496. - PubMed
    1. Atkins K. M., Thomas L., Youker R. T., Harriff M. J., Pissani F., You H., Thomas G. HIV-1 Nef Binds PACS-2 to Assemble a Multikinase Cascade That Triggers Major Histocompatibility Complex Class I (MHC-I) Down-regulation: analysis using short interfering RNA and knock-out mice. J. Biol. Chem. 2008;283:11772–11784. - PMC - PubMed
    1. Betzi S., Restouin A., Opi S., Arold S. T., Parrot I., Guerlesquin F., Morelli X., Collette Y. Protein protein interaction inhibition (2P2I) combining high throughput and virtual screening: Application to the HIV-1 Nef protein. Proc. Natl. Acad. Sci. USA. 2007;104:19256–19261. - PMC - PubMed

Publication types

MeSH terms

Substances